In this article we'll walk through how you can connect your reports to Microsoft Excel for even more power when dealing with reports.
Overview
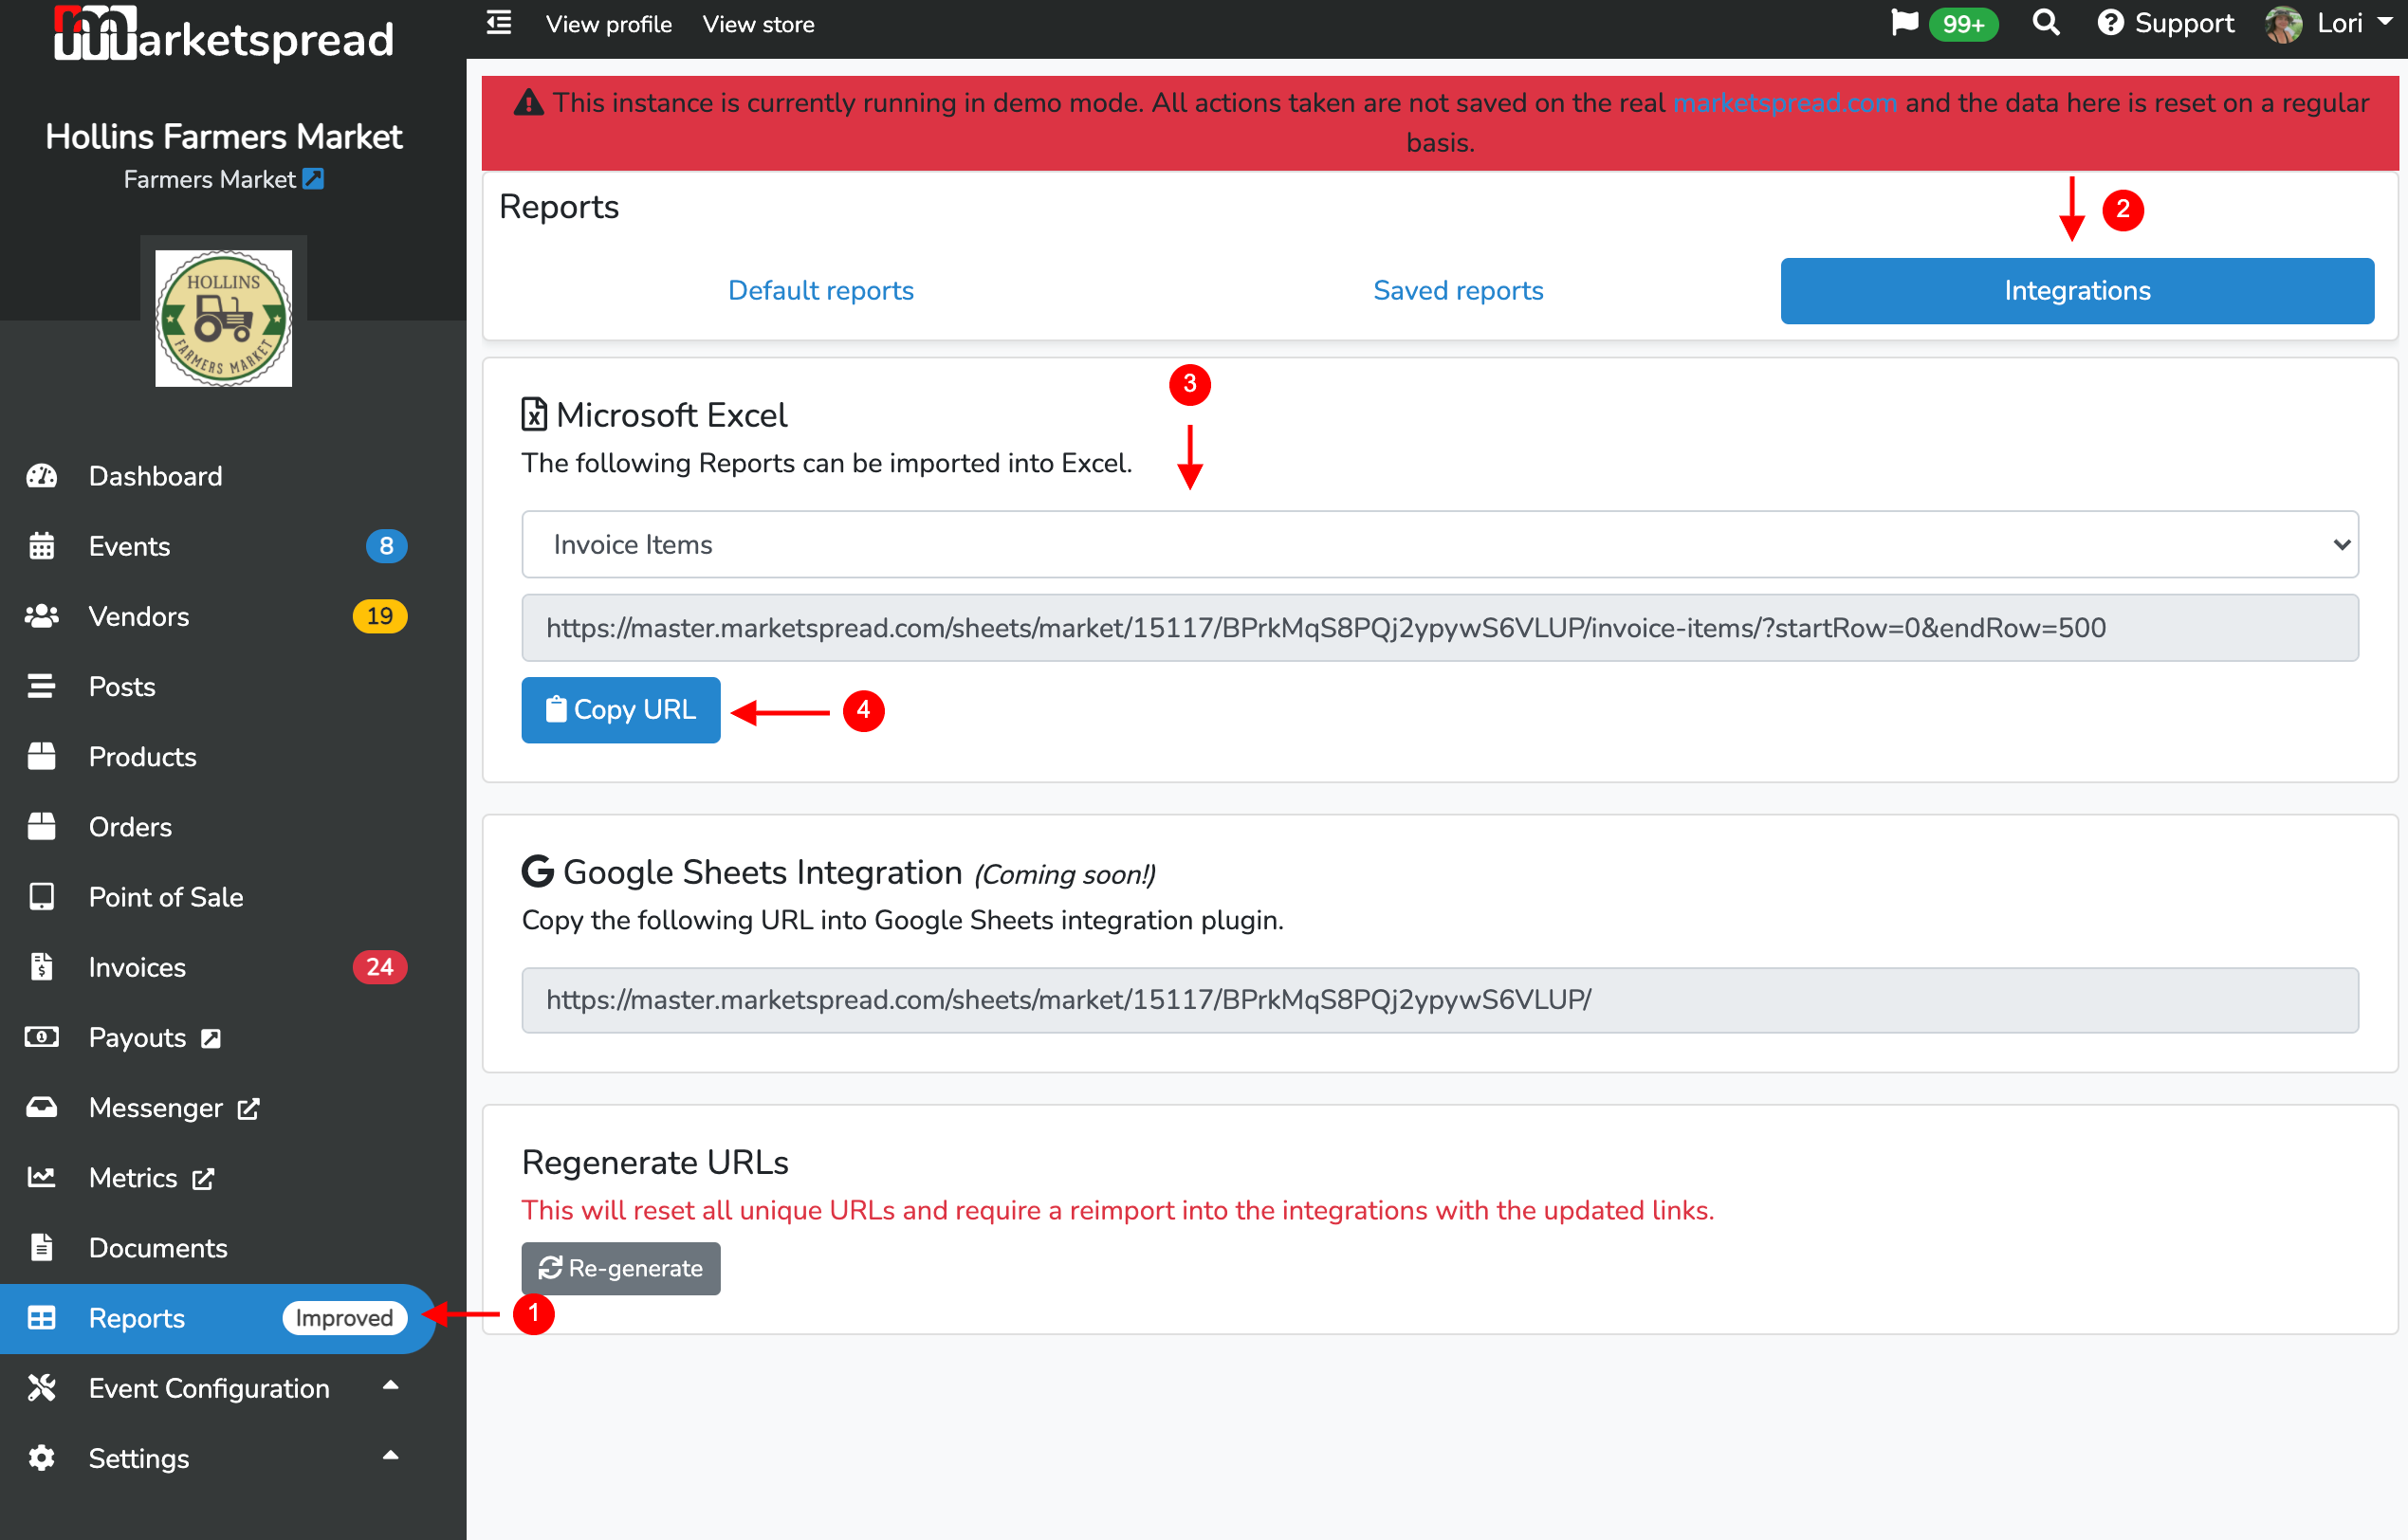
Step 1. Access the integrations
First step is to visit your reports page in the dashboard and go to integrations. On the integrations page under Microsoft Excel choose the report you wish to import and click on Copy URL.
Step 2. Load the data into Excel
Next, with the URL copied to our clipboard, we'll need to import that data into Excel for processing
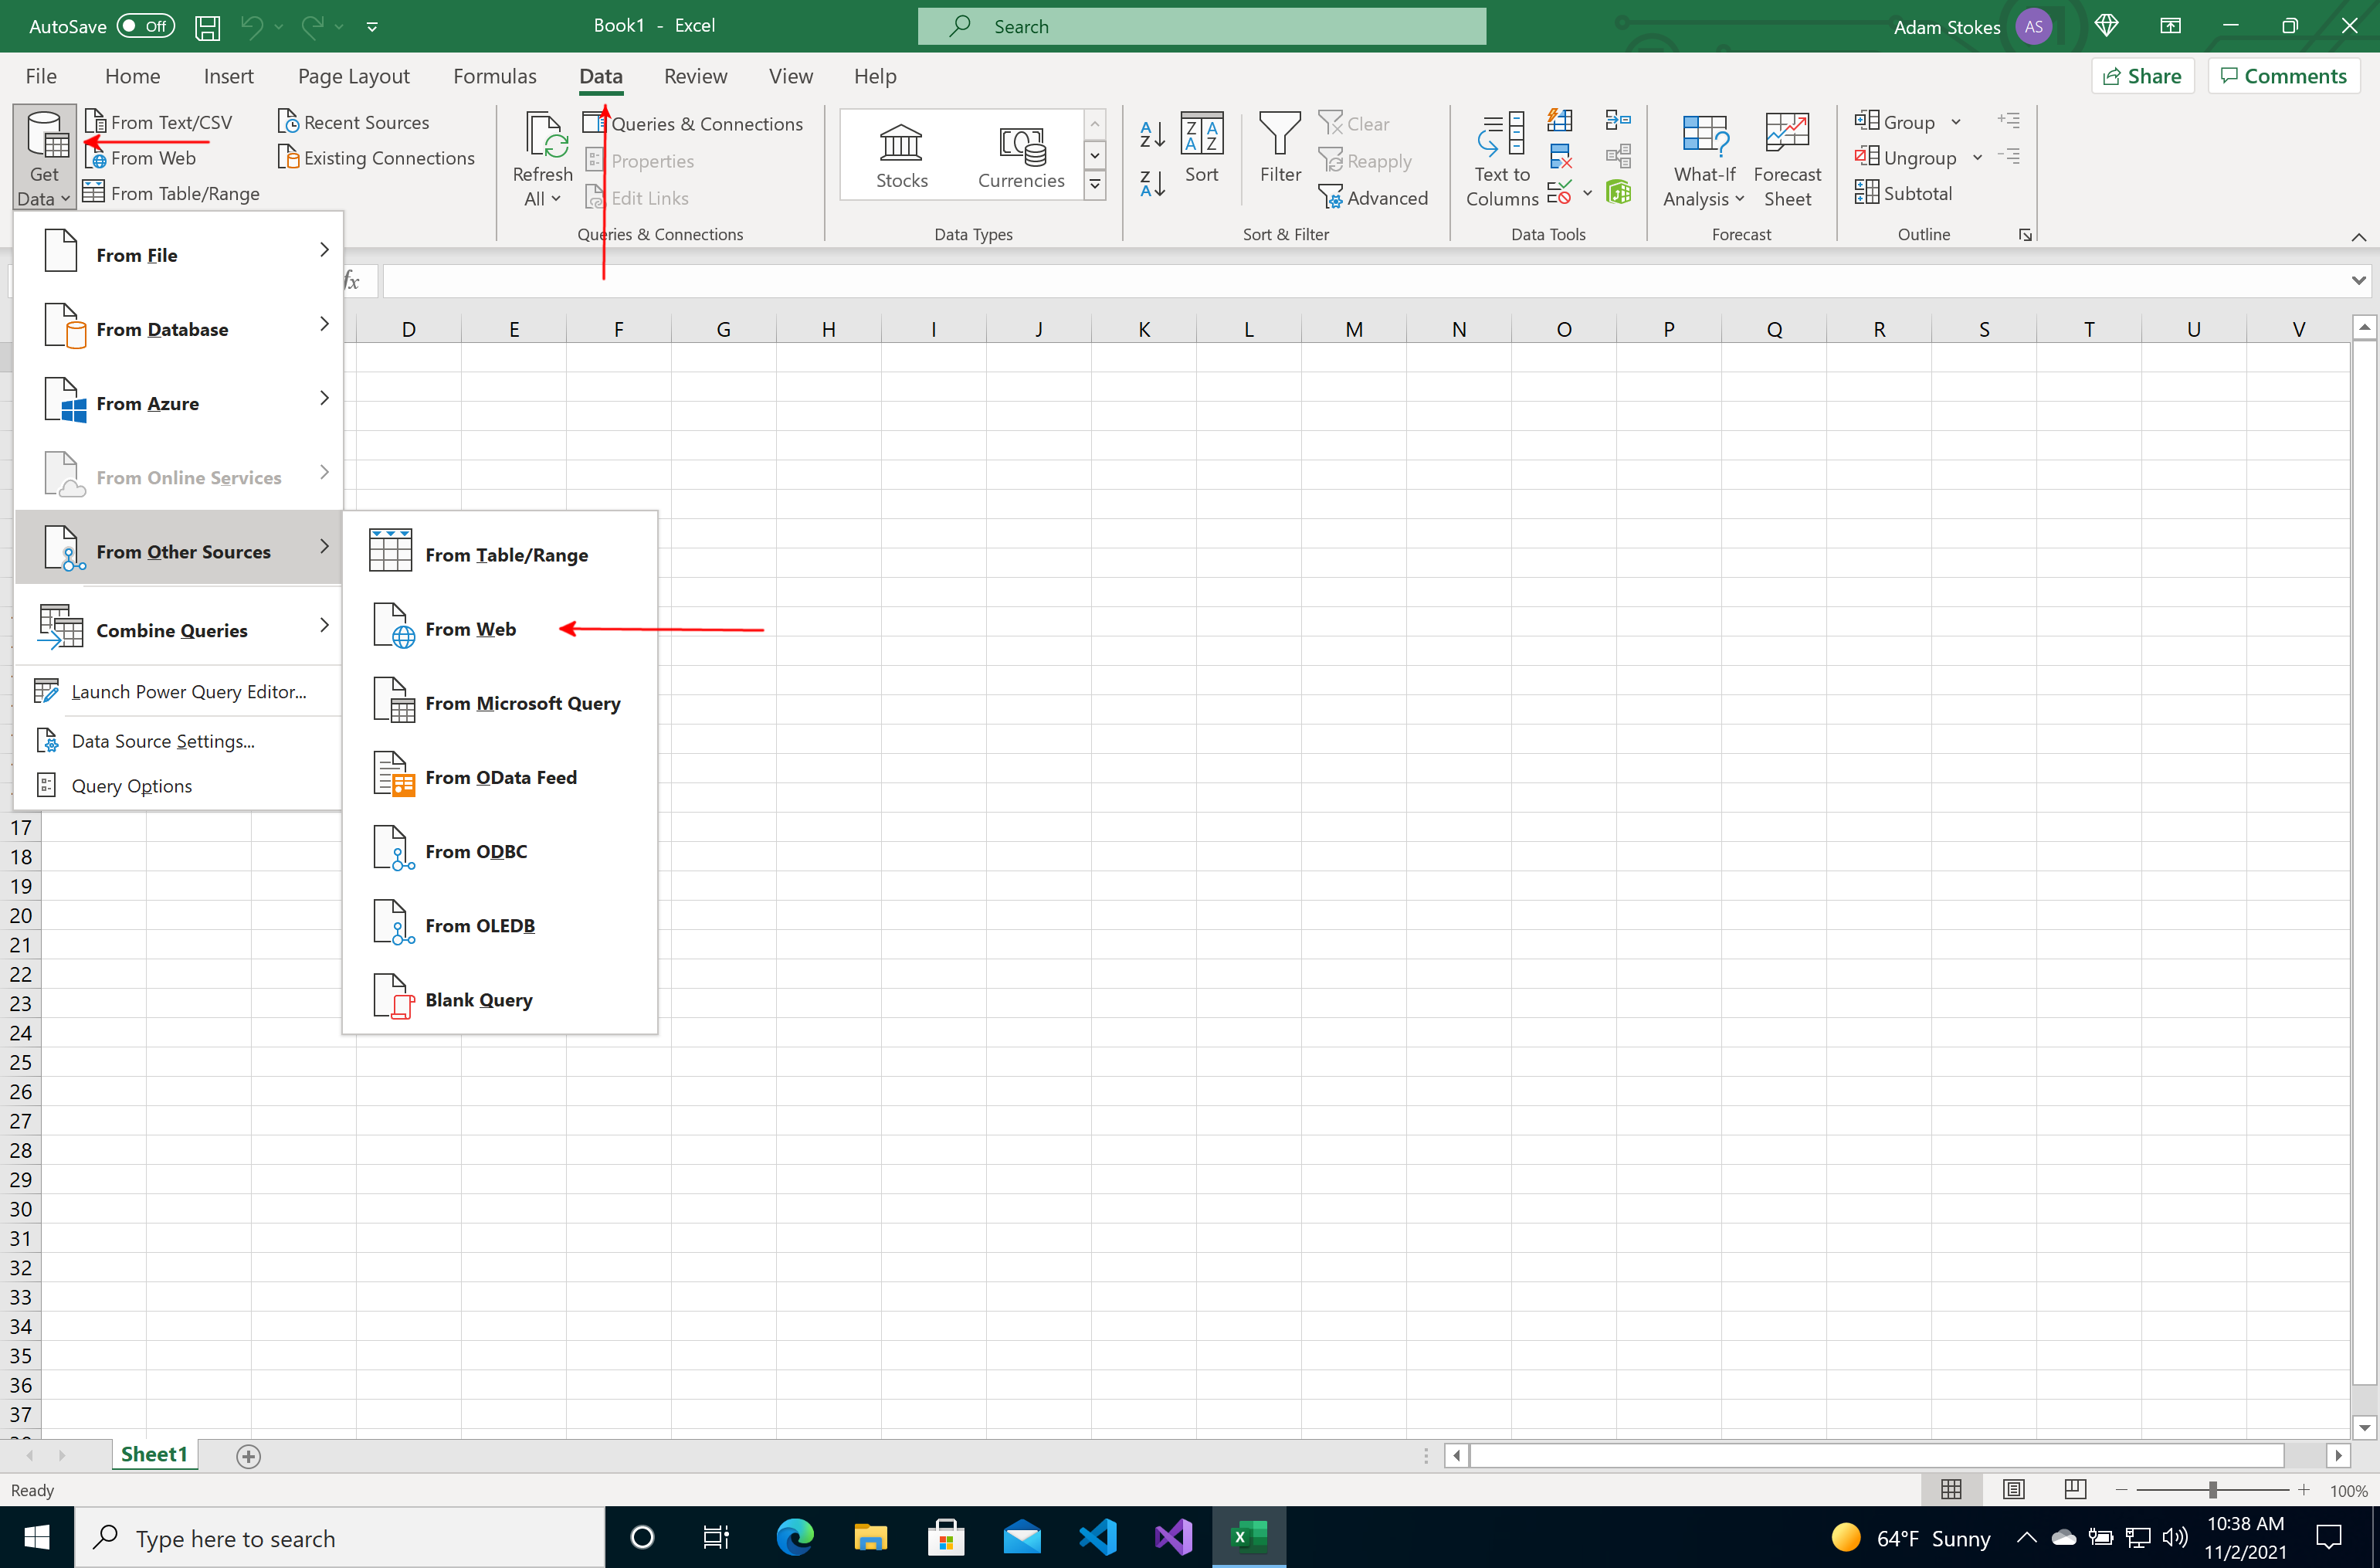
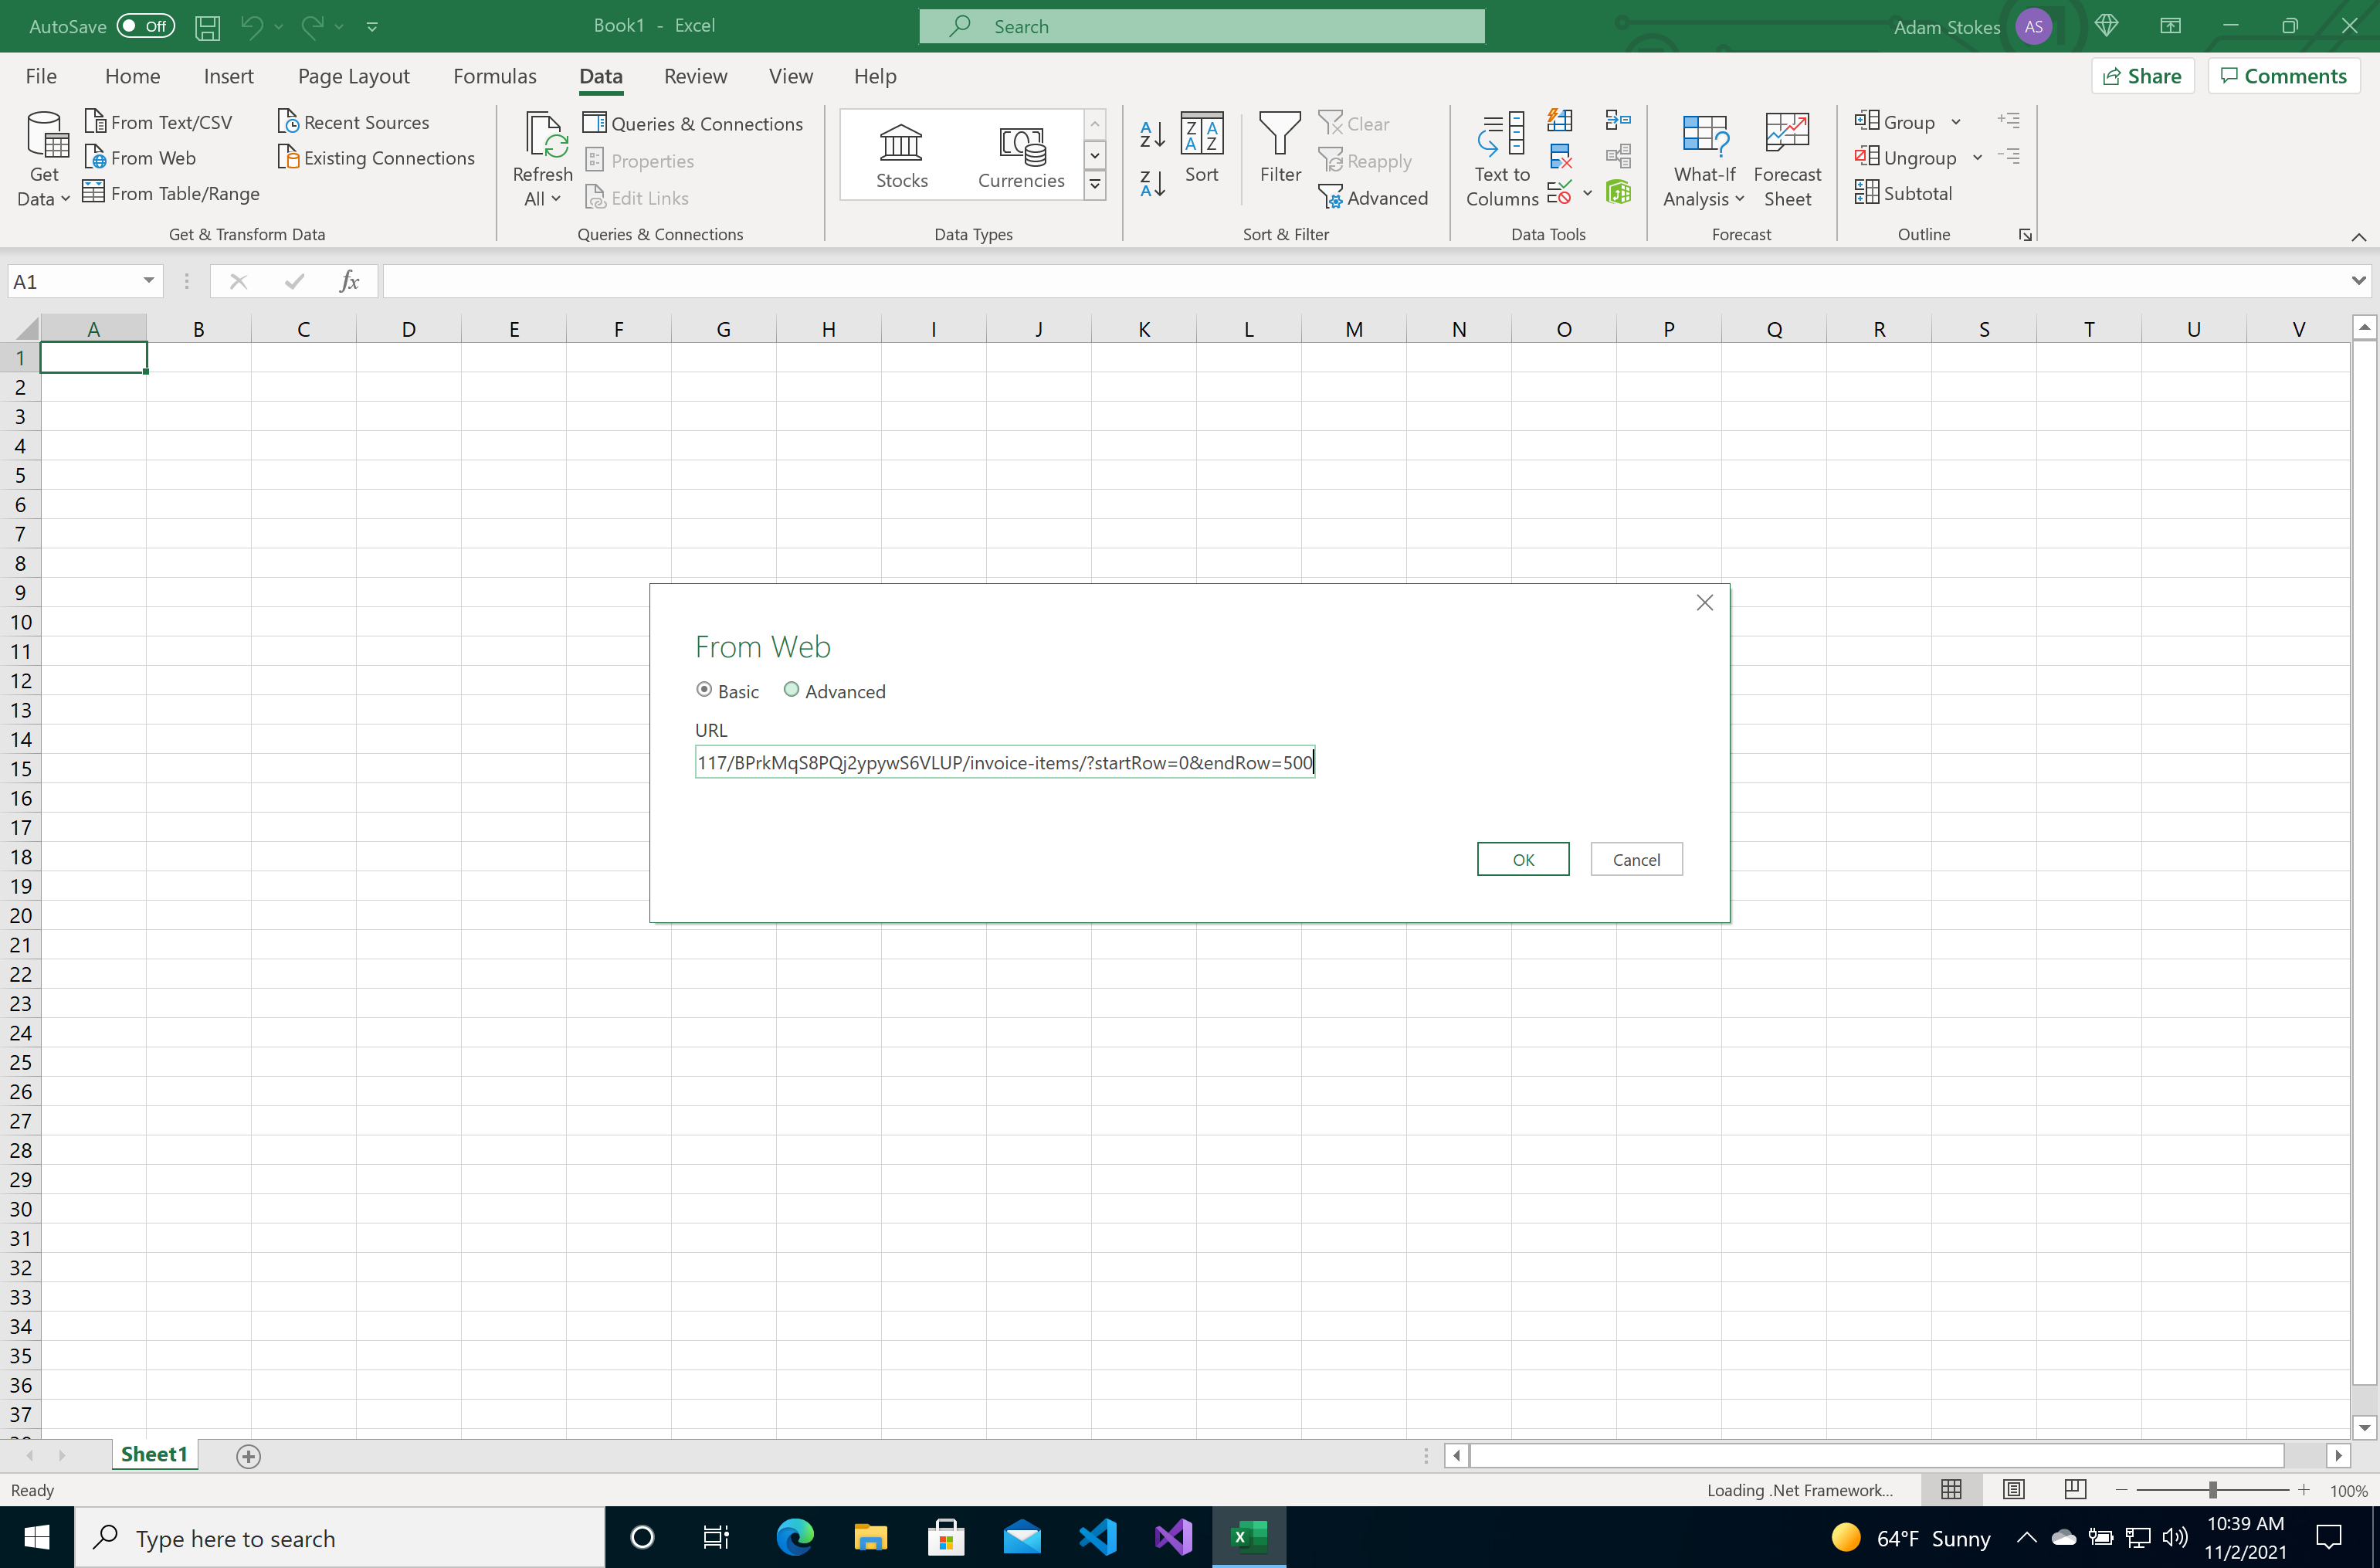
Step 3. Paste in the URL to import
We need to tell Excel where to download the data from
Step 4. Access Power Query
Once the data is imported, Power Query will popup allowing you to drill down into the data and extract the information you need into the spreadsheet
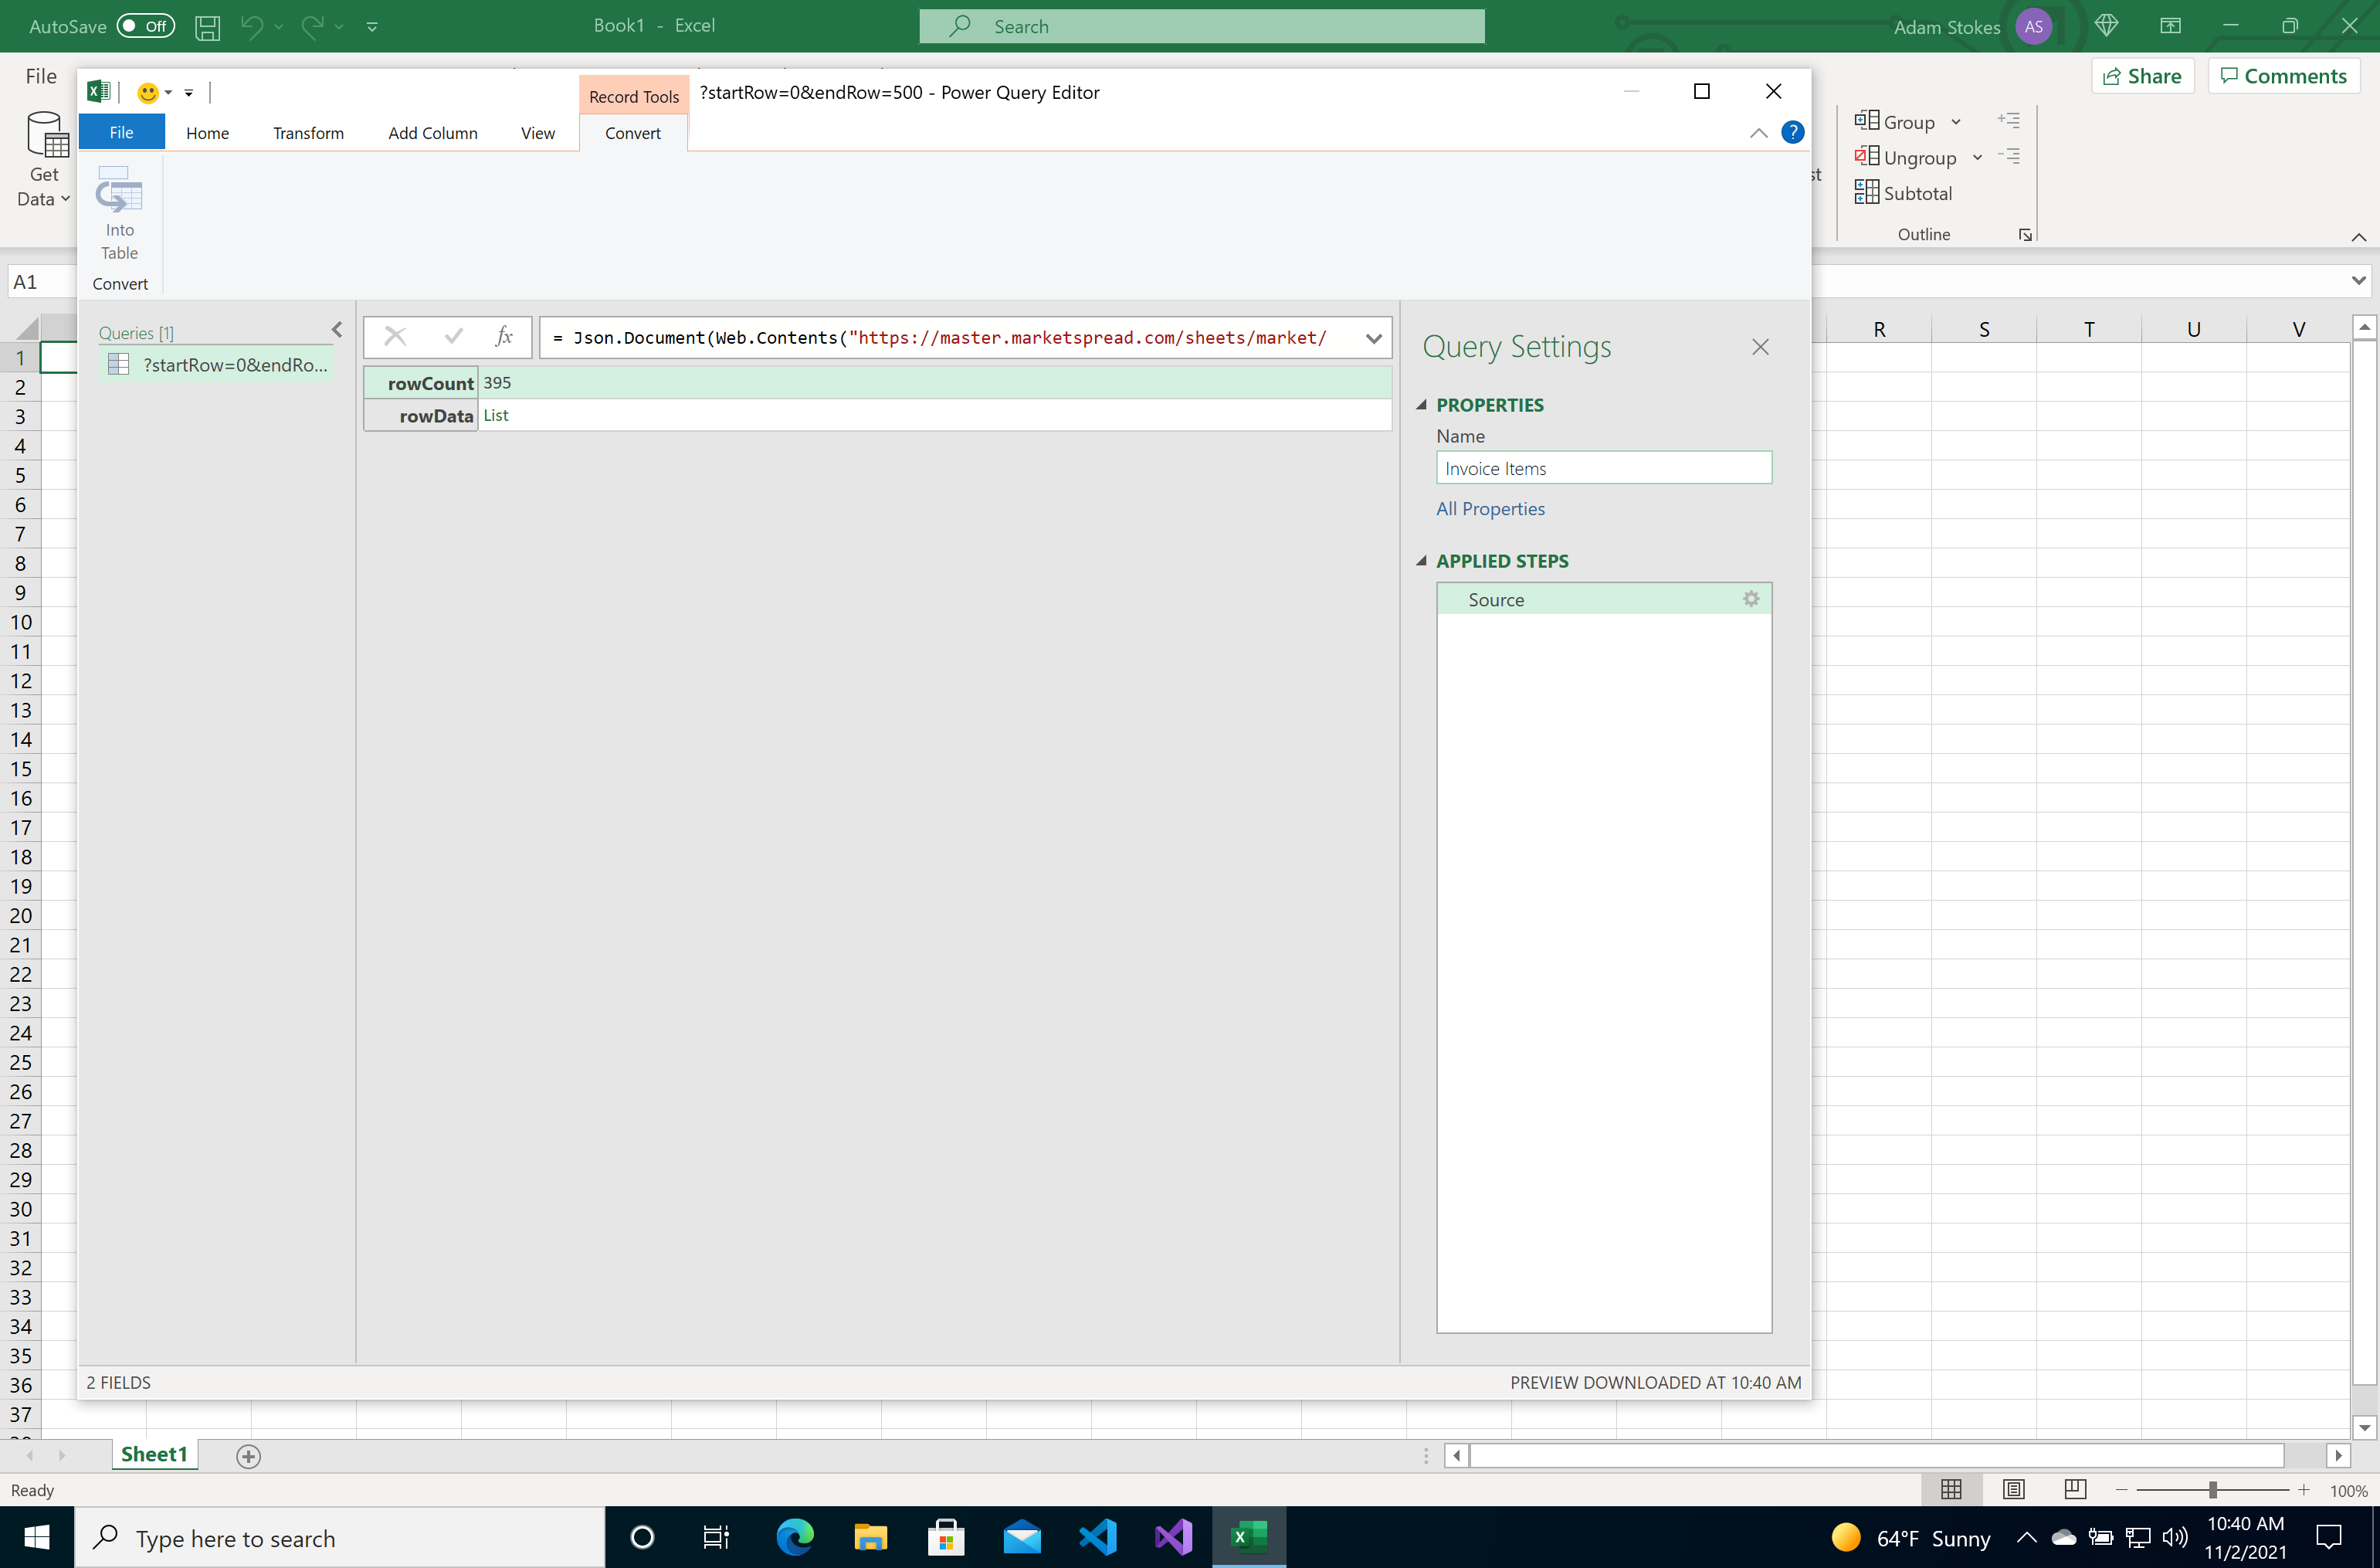
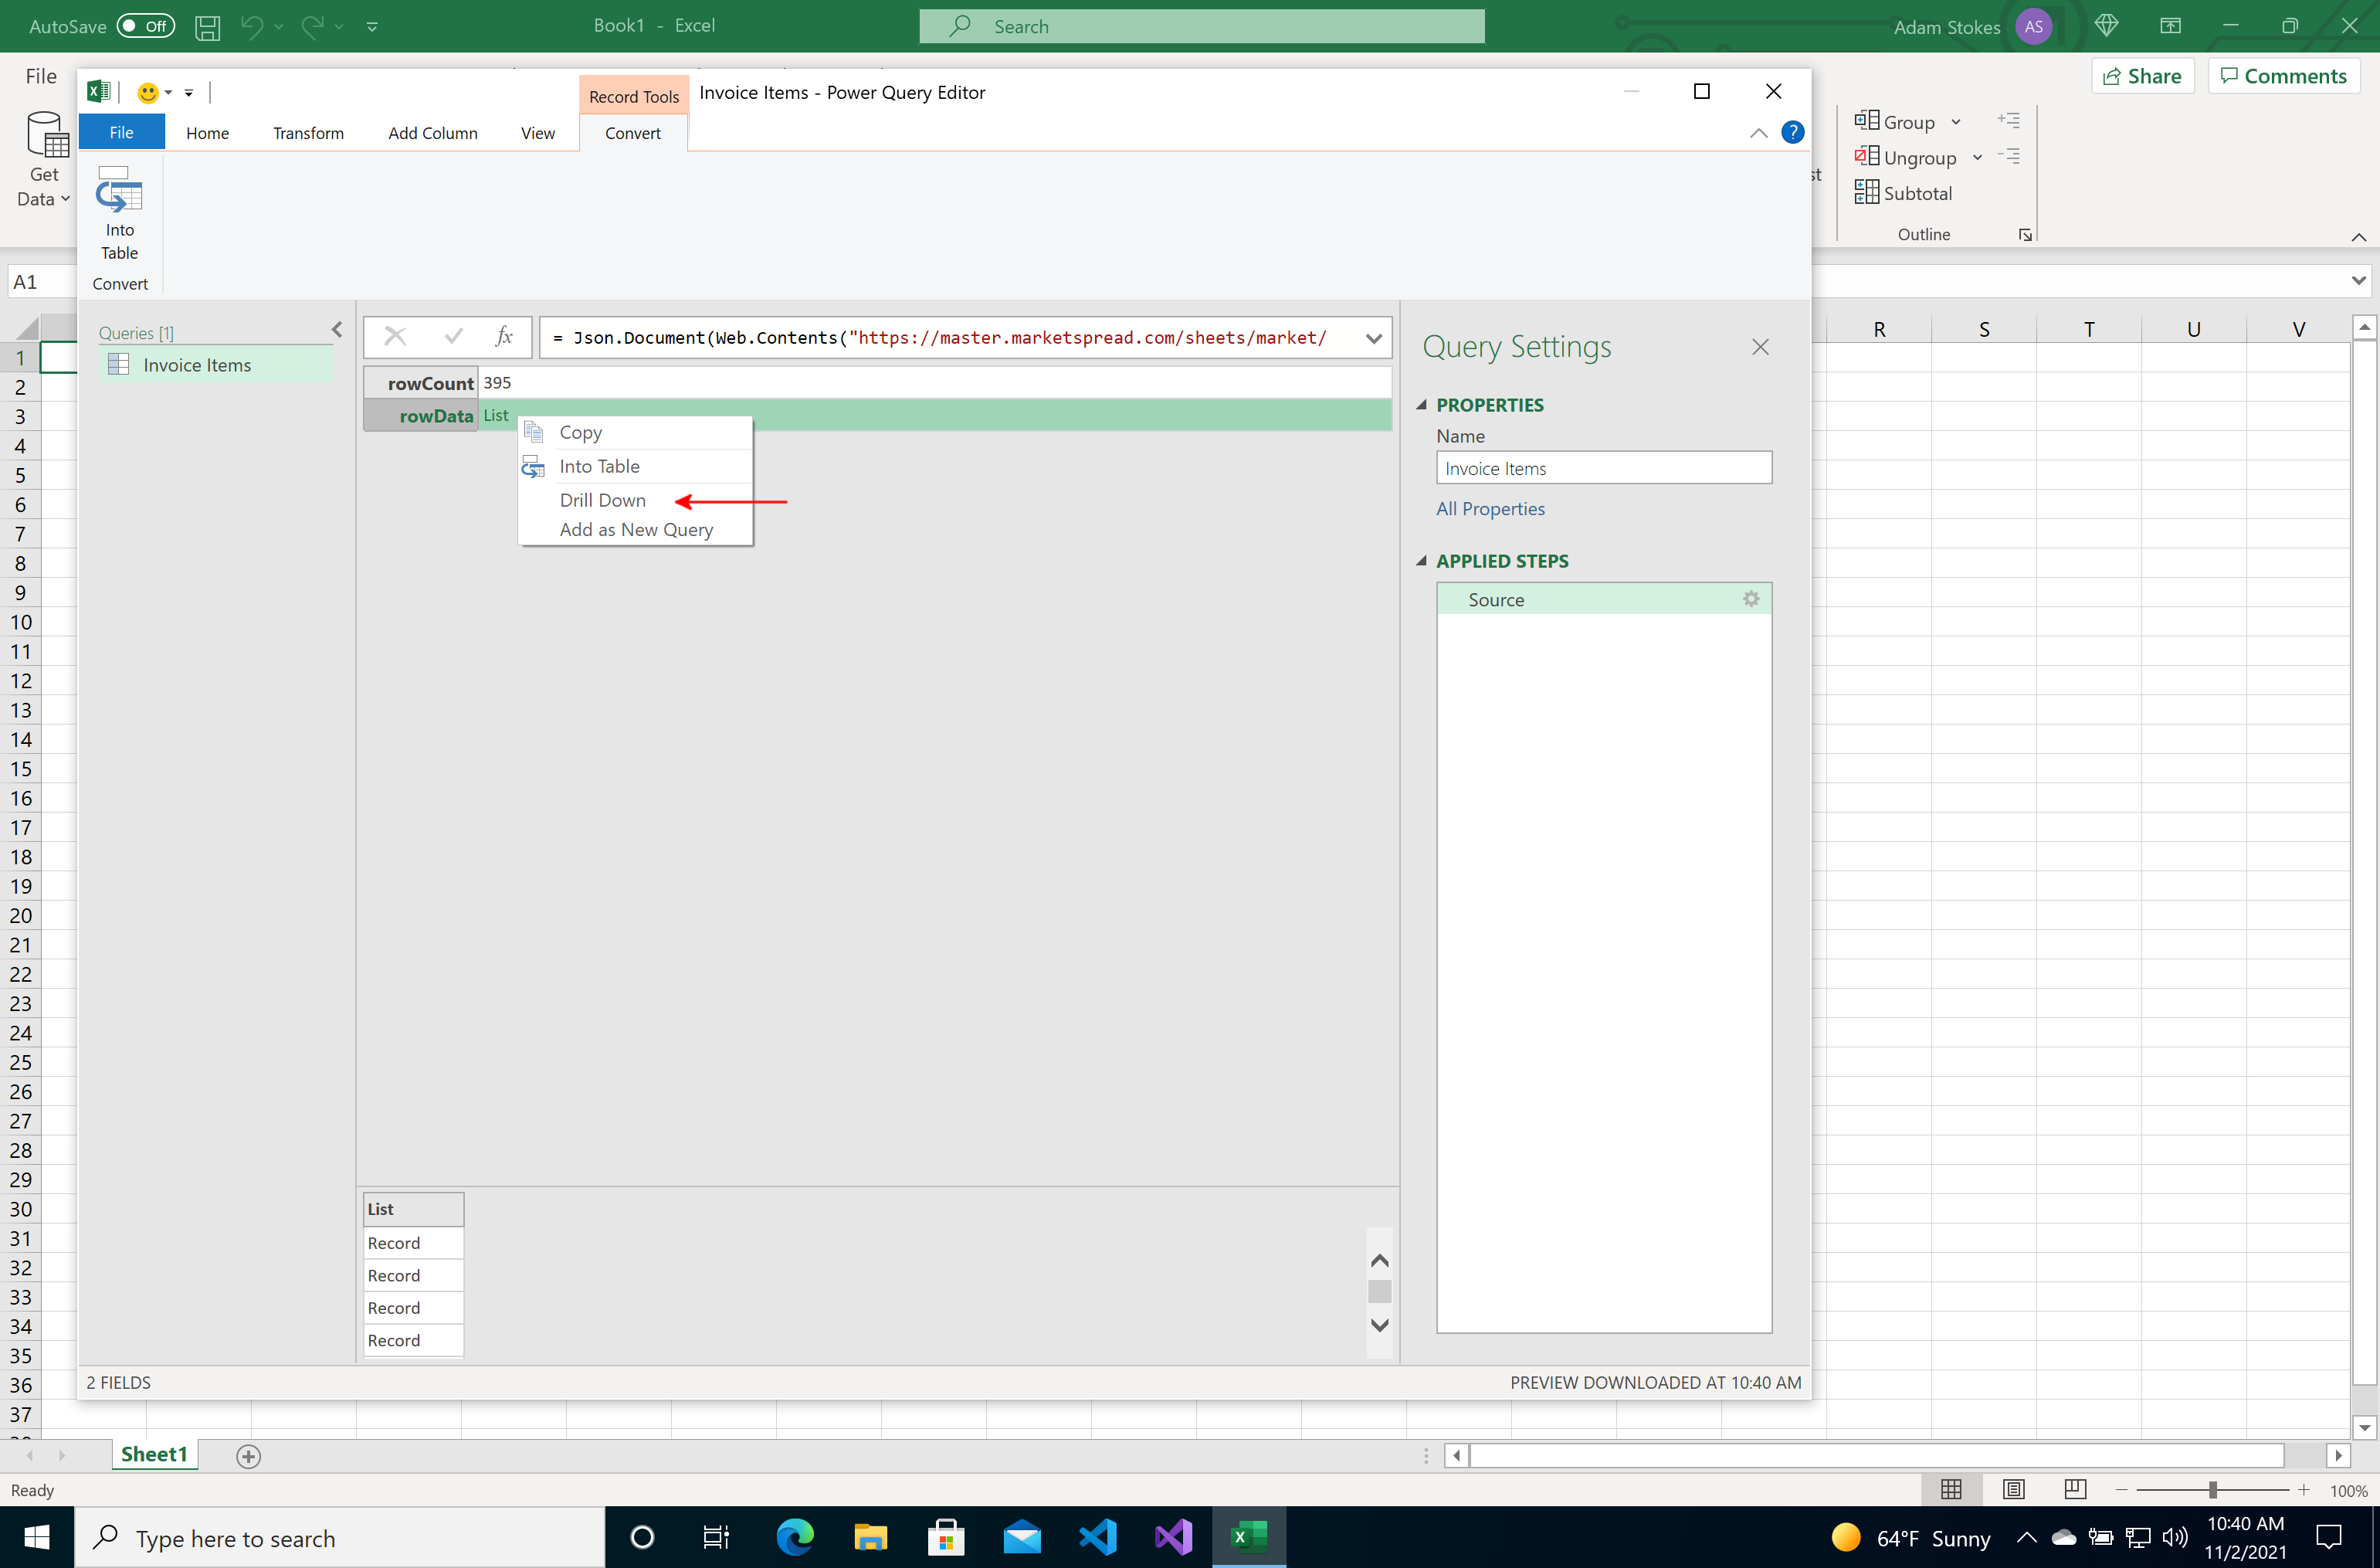
Step 5. Drill down into the set of data
In the screenshot below, there are current 2 rows Power Query has found. In the second row you'll notice the value of List, this is an object representation of a "List of data". Since this is the particular data we are interested in we need to drill down into that row. Right click on the second row and click on "Drill down" in the menu option as seen below:
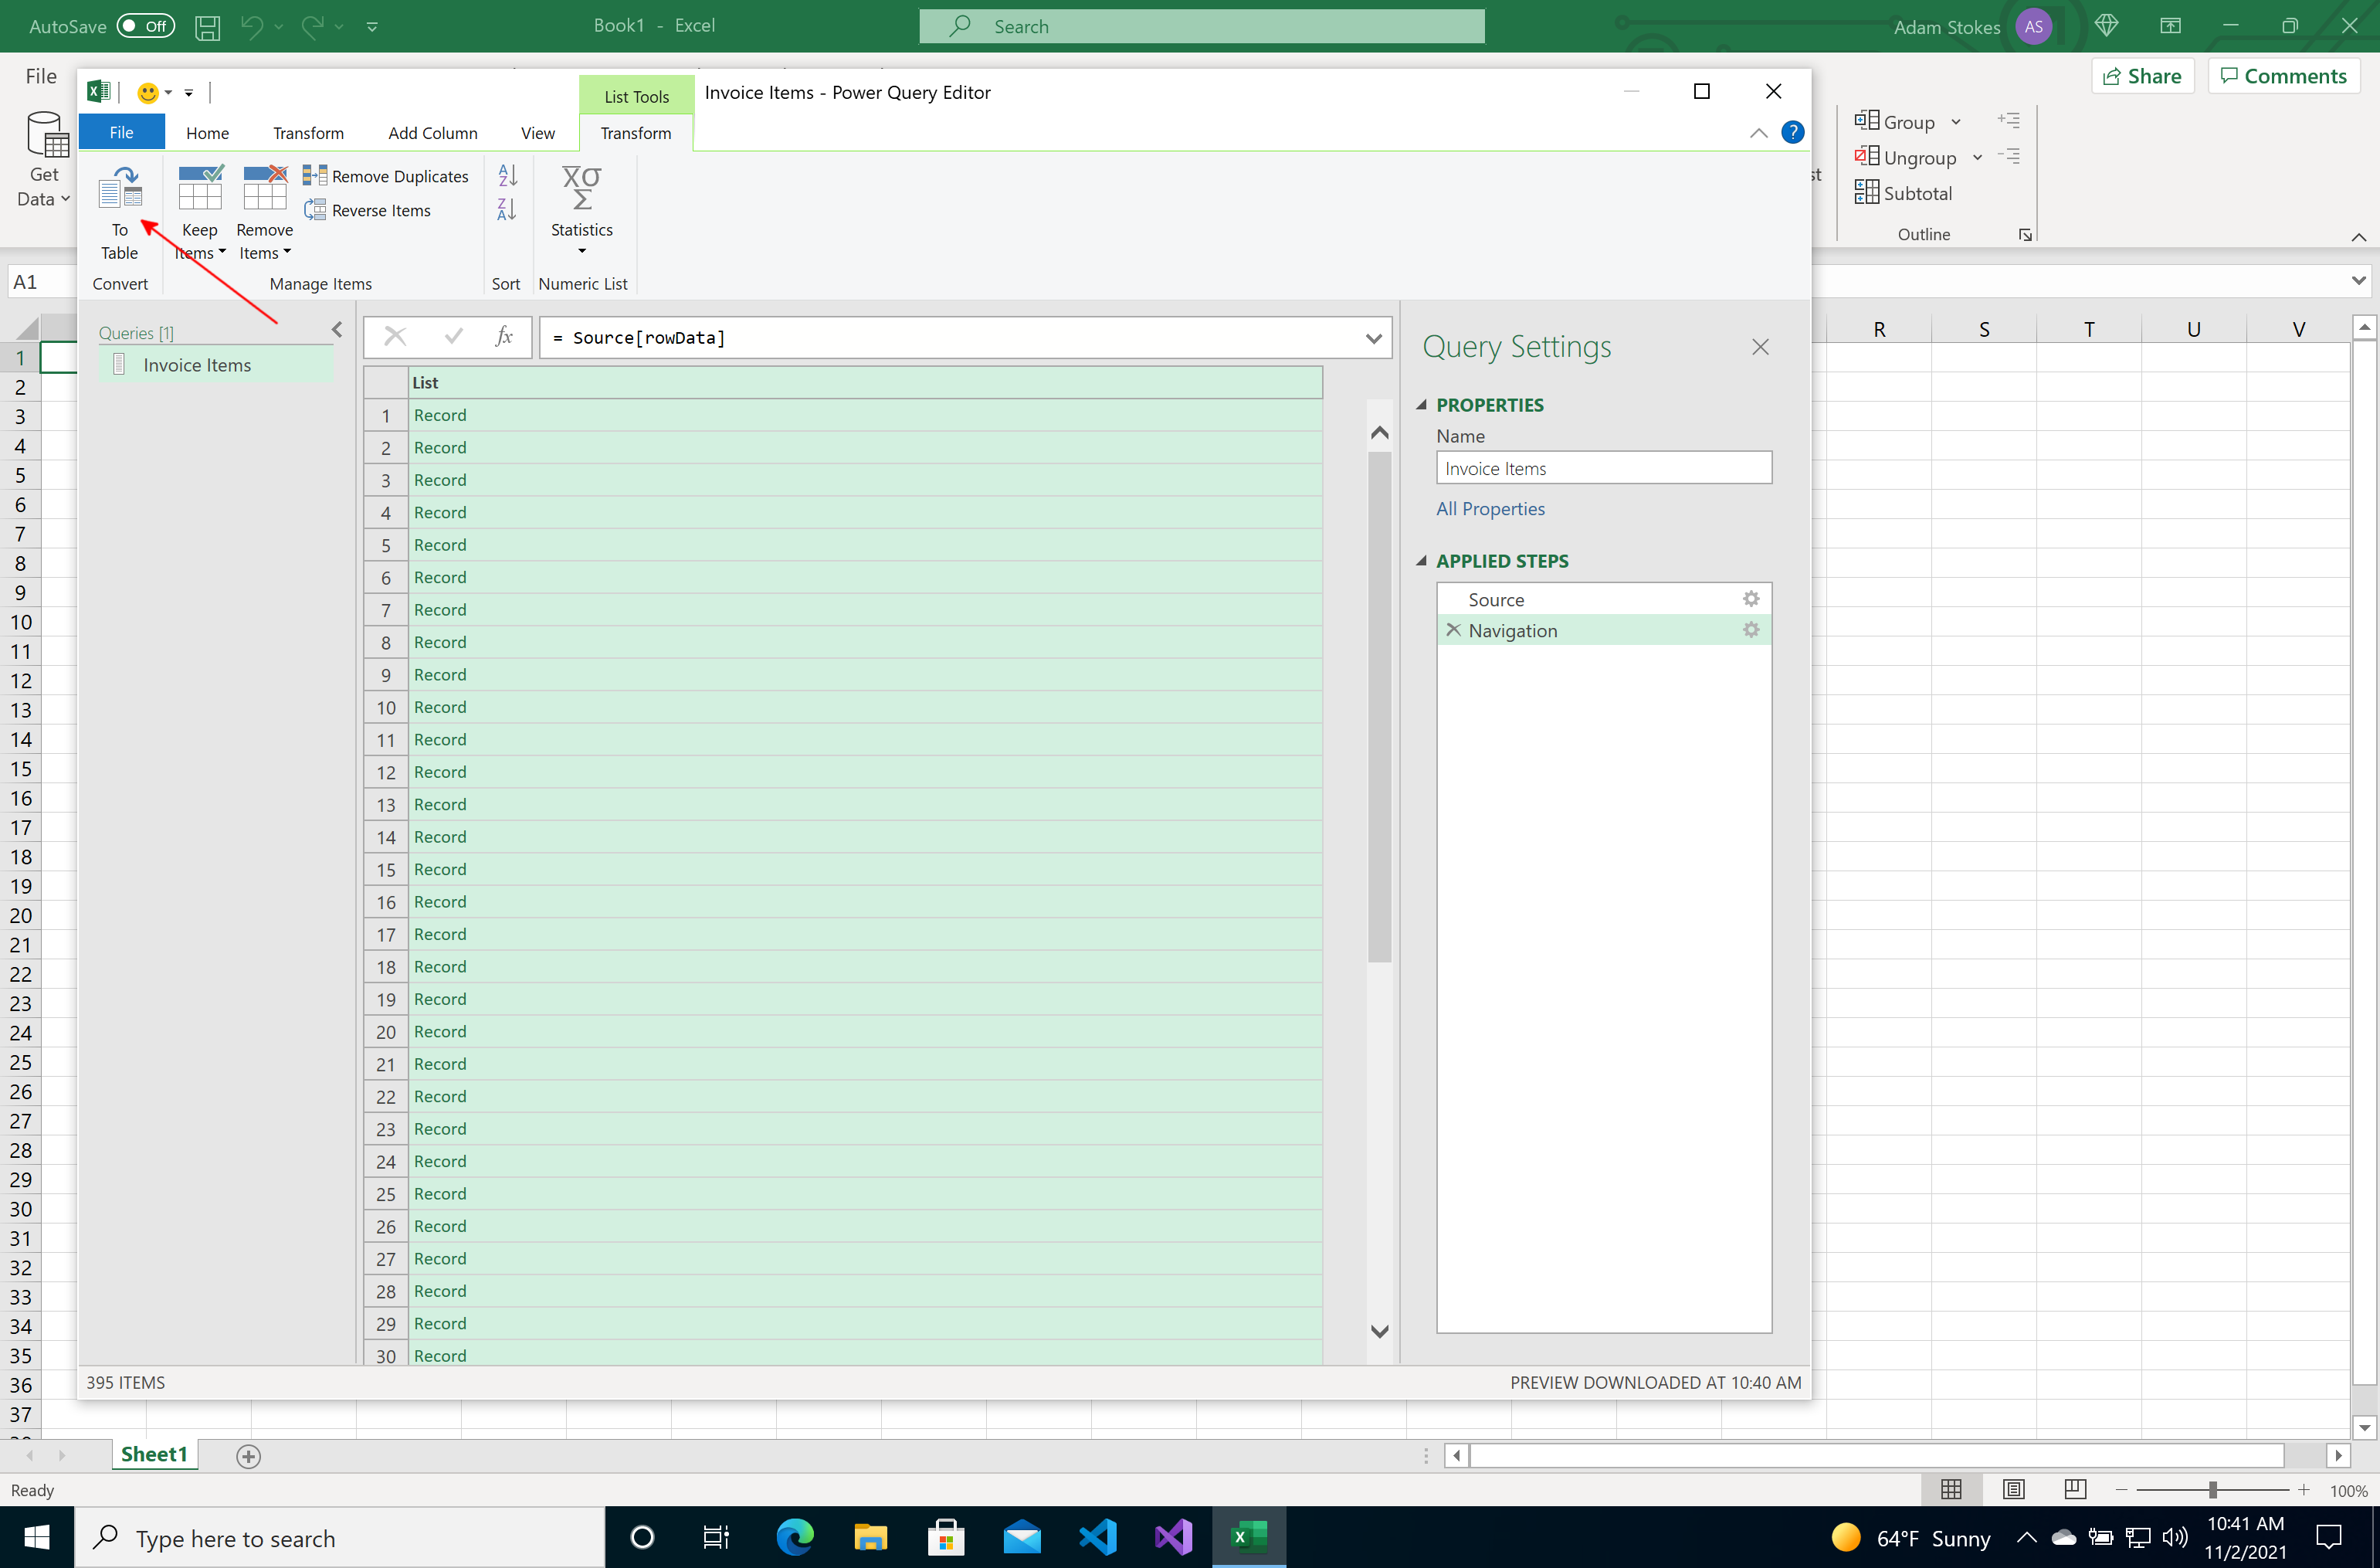
Step 6. Convert the data into a table
Now that the data has been expanded, convert it into a table
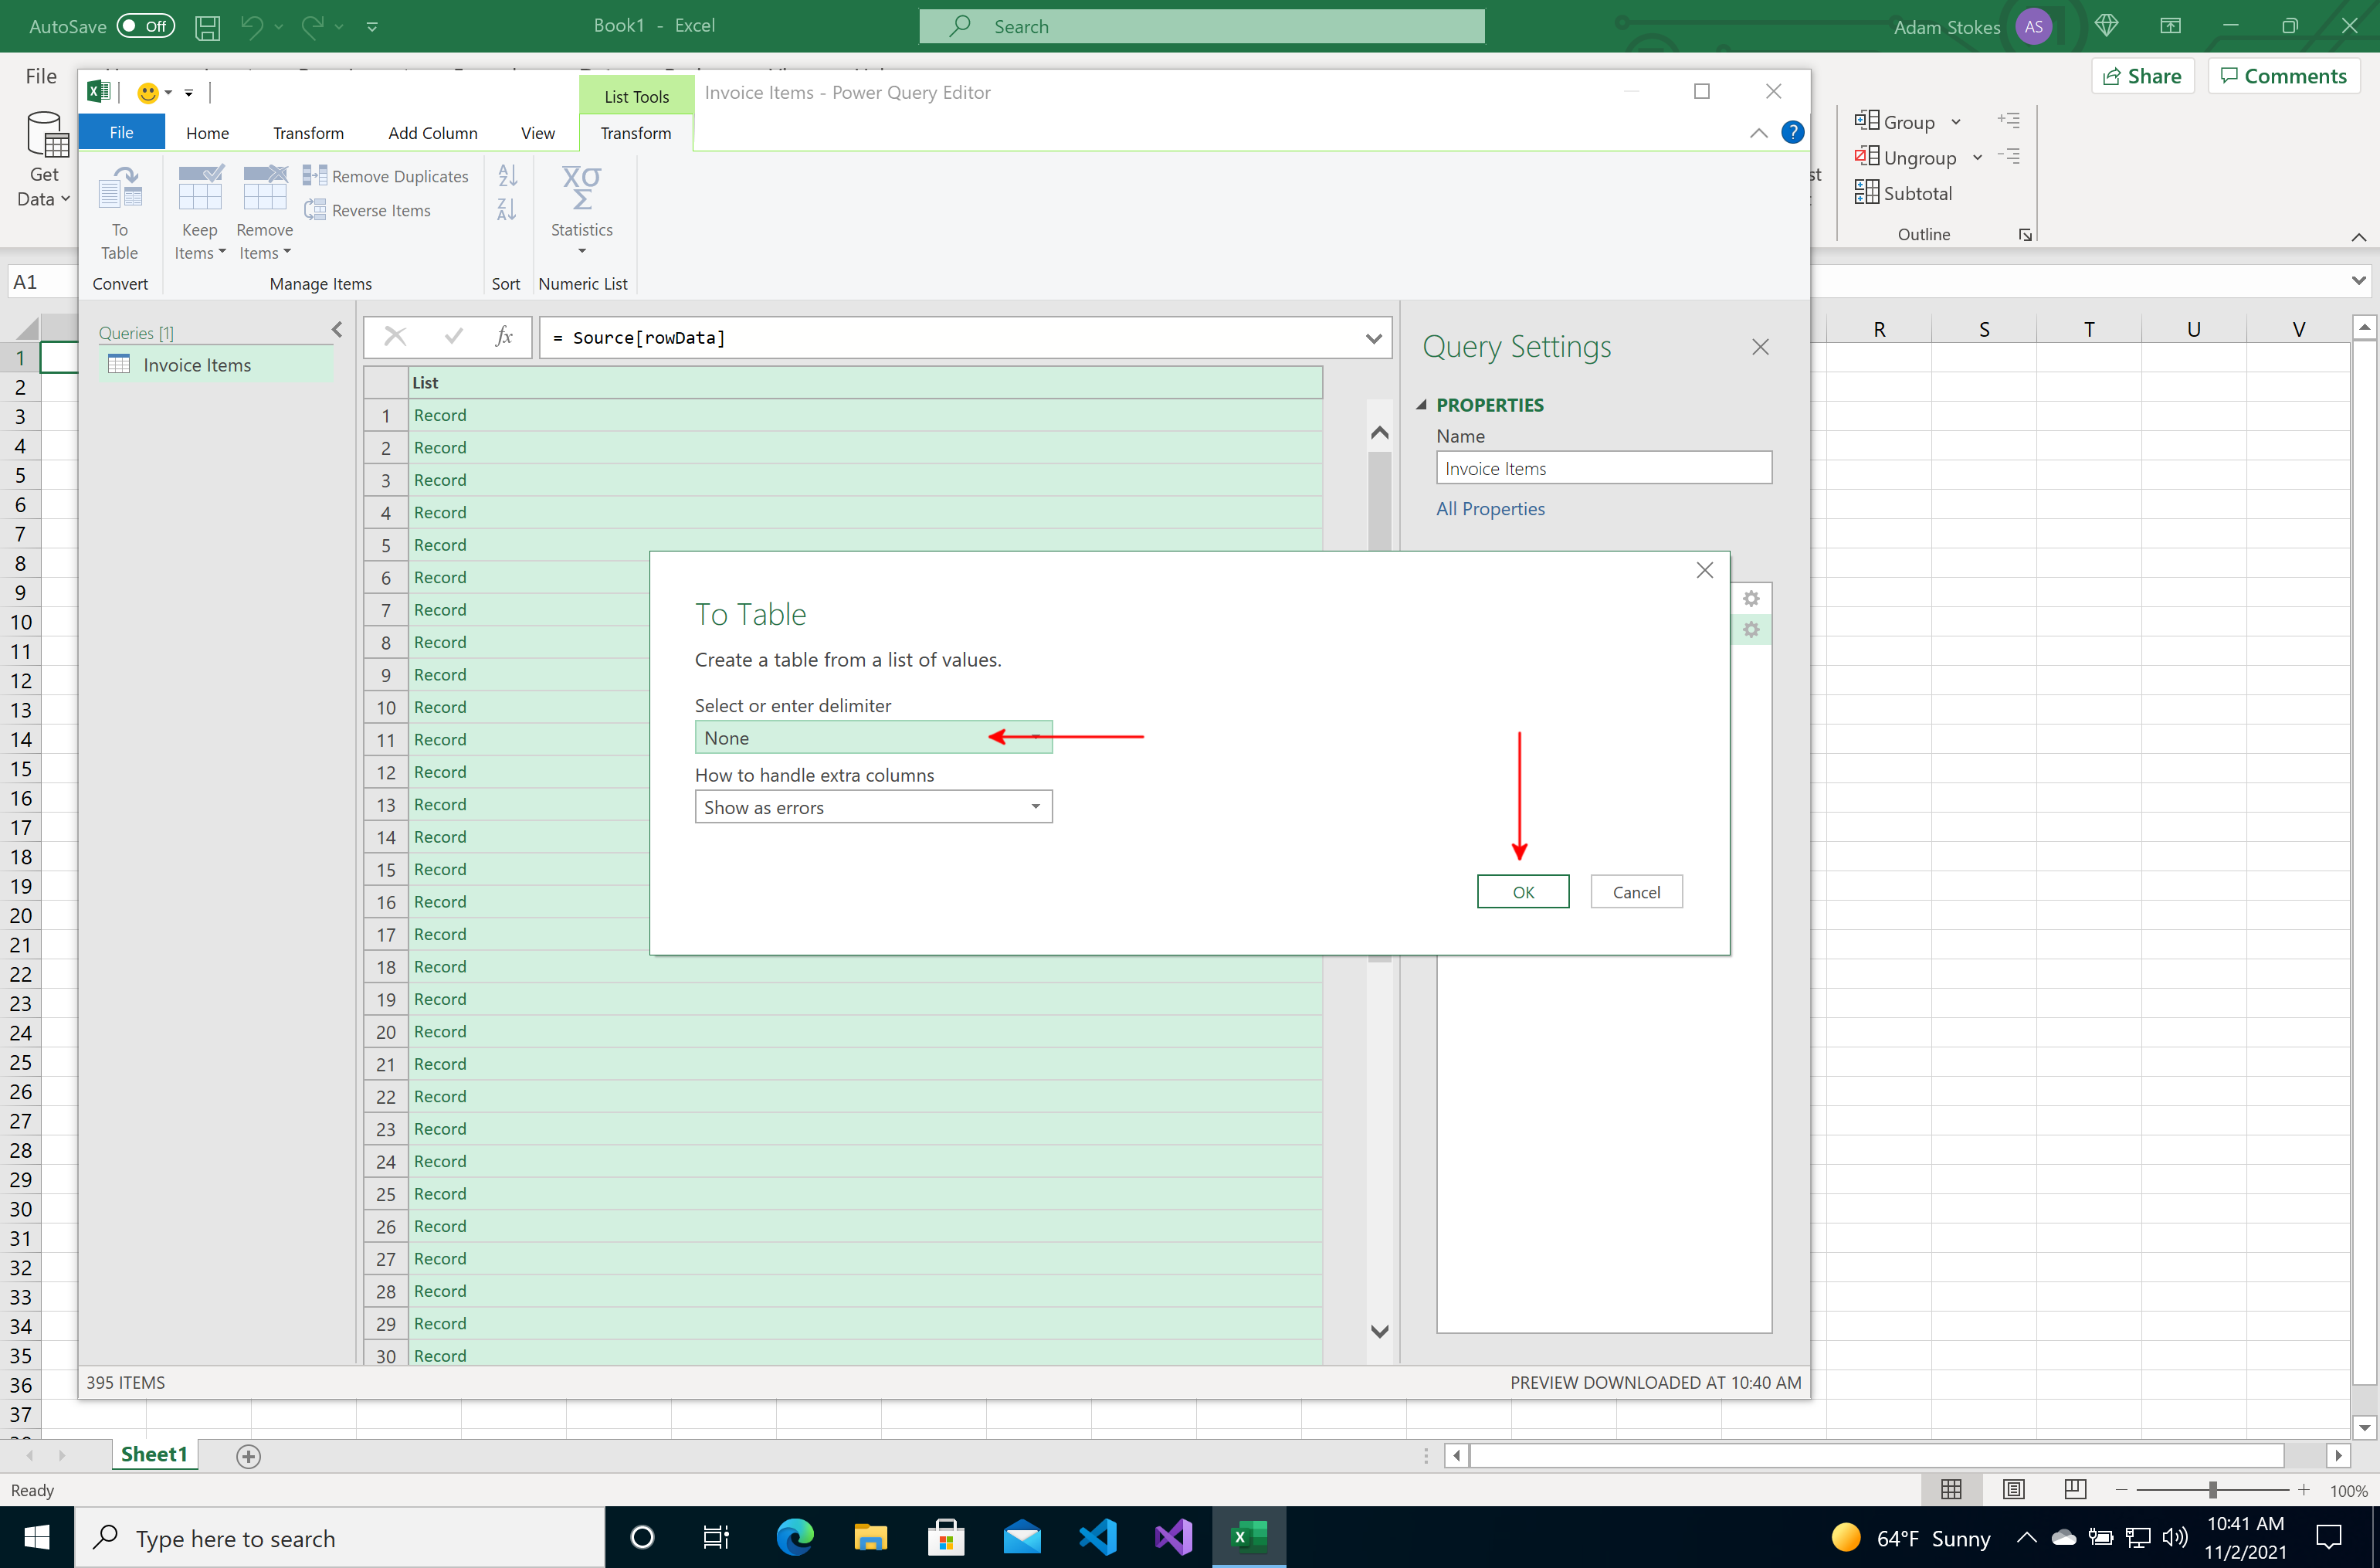
Confirm the import, it is not required to set any sort of delimeter and press OK
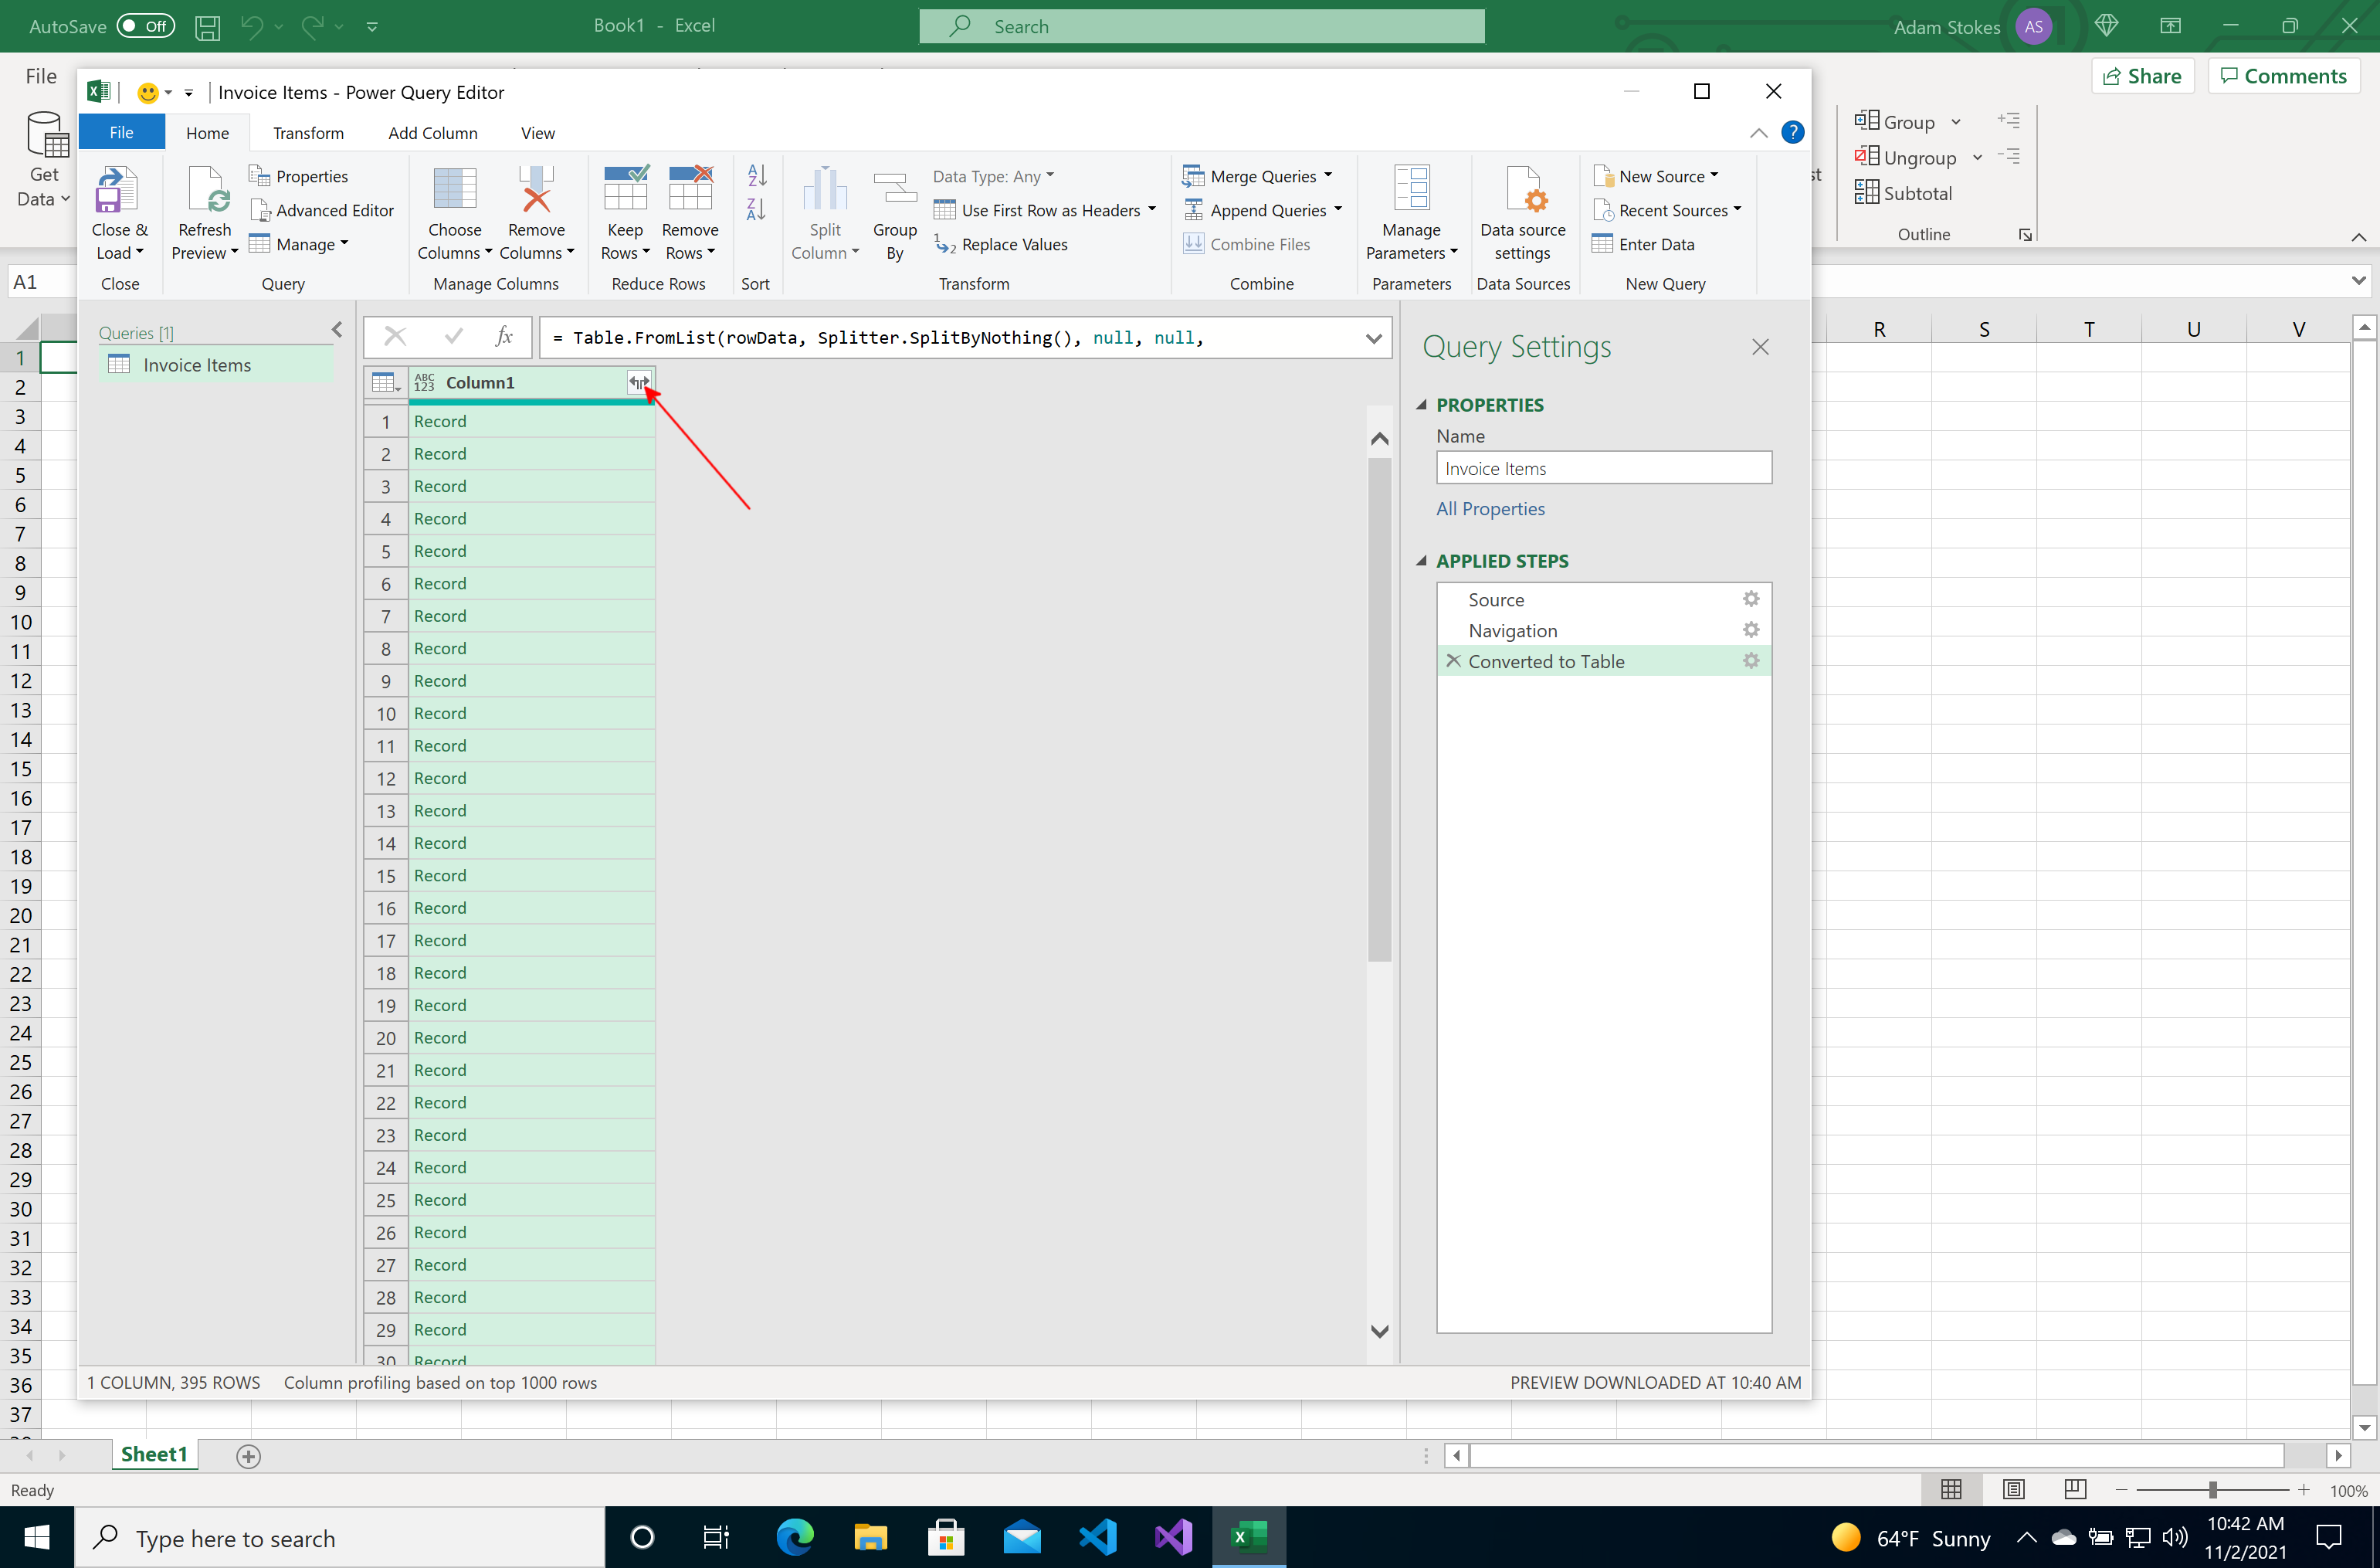
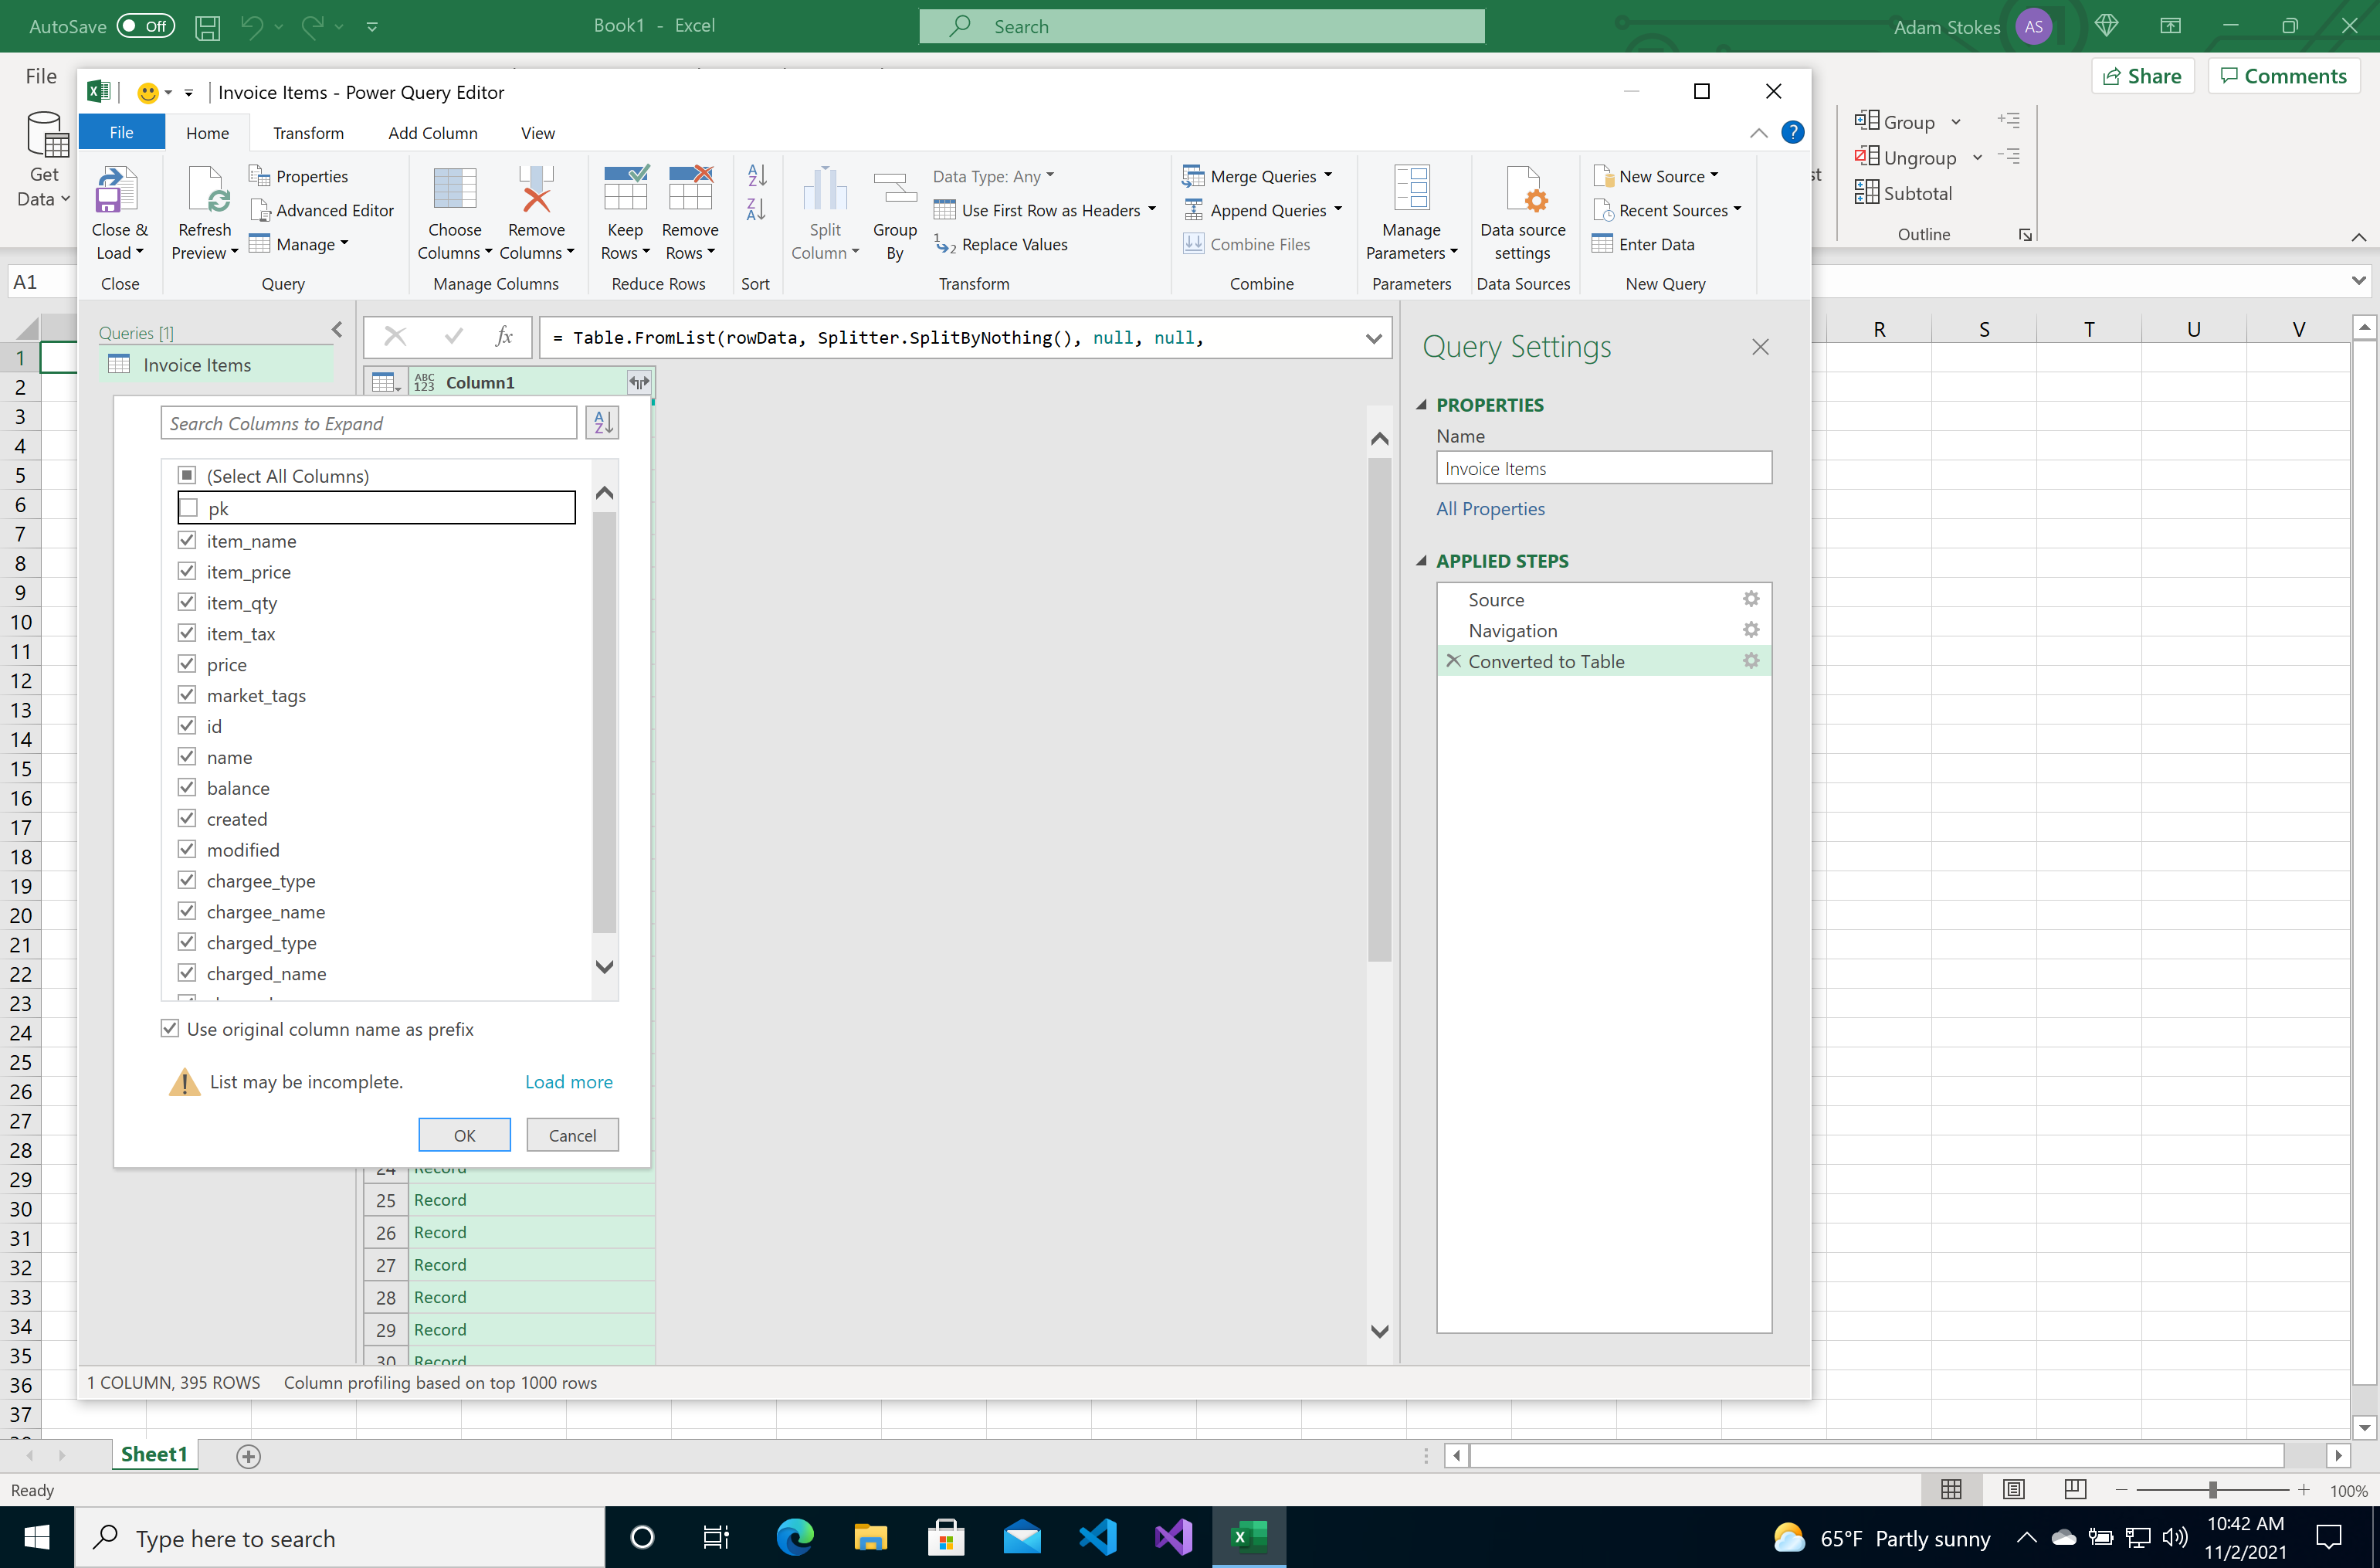
Step 7. Expand the data into columns
Before we can import this data into the spreadsheet, the data needs to be expanded so that the columns appear with the data:
You can optionally select which columns to include in the spreadsheet
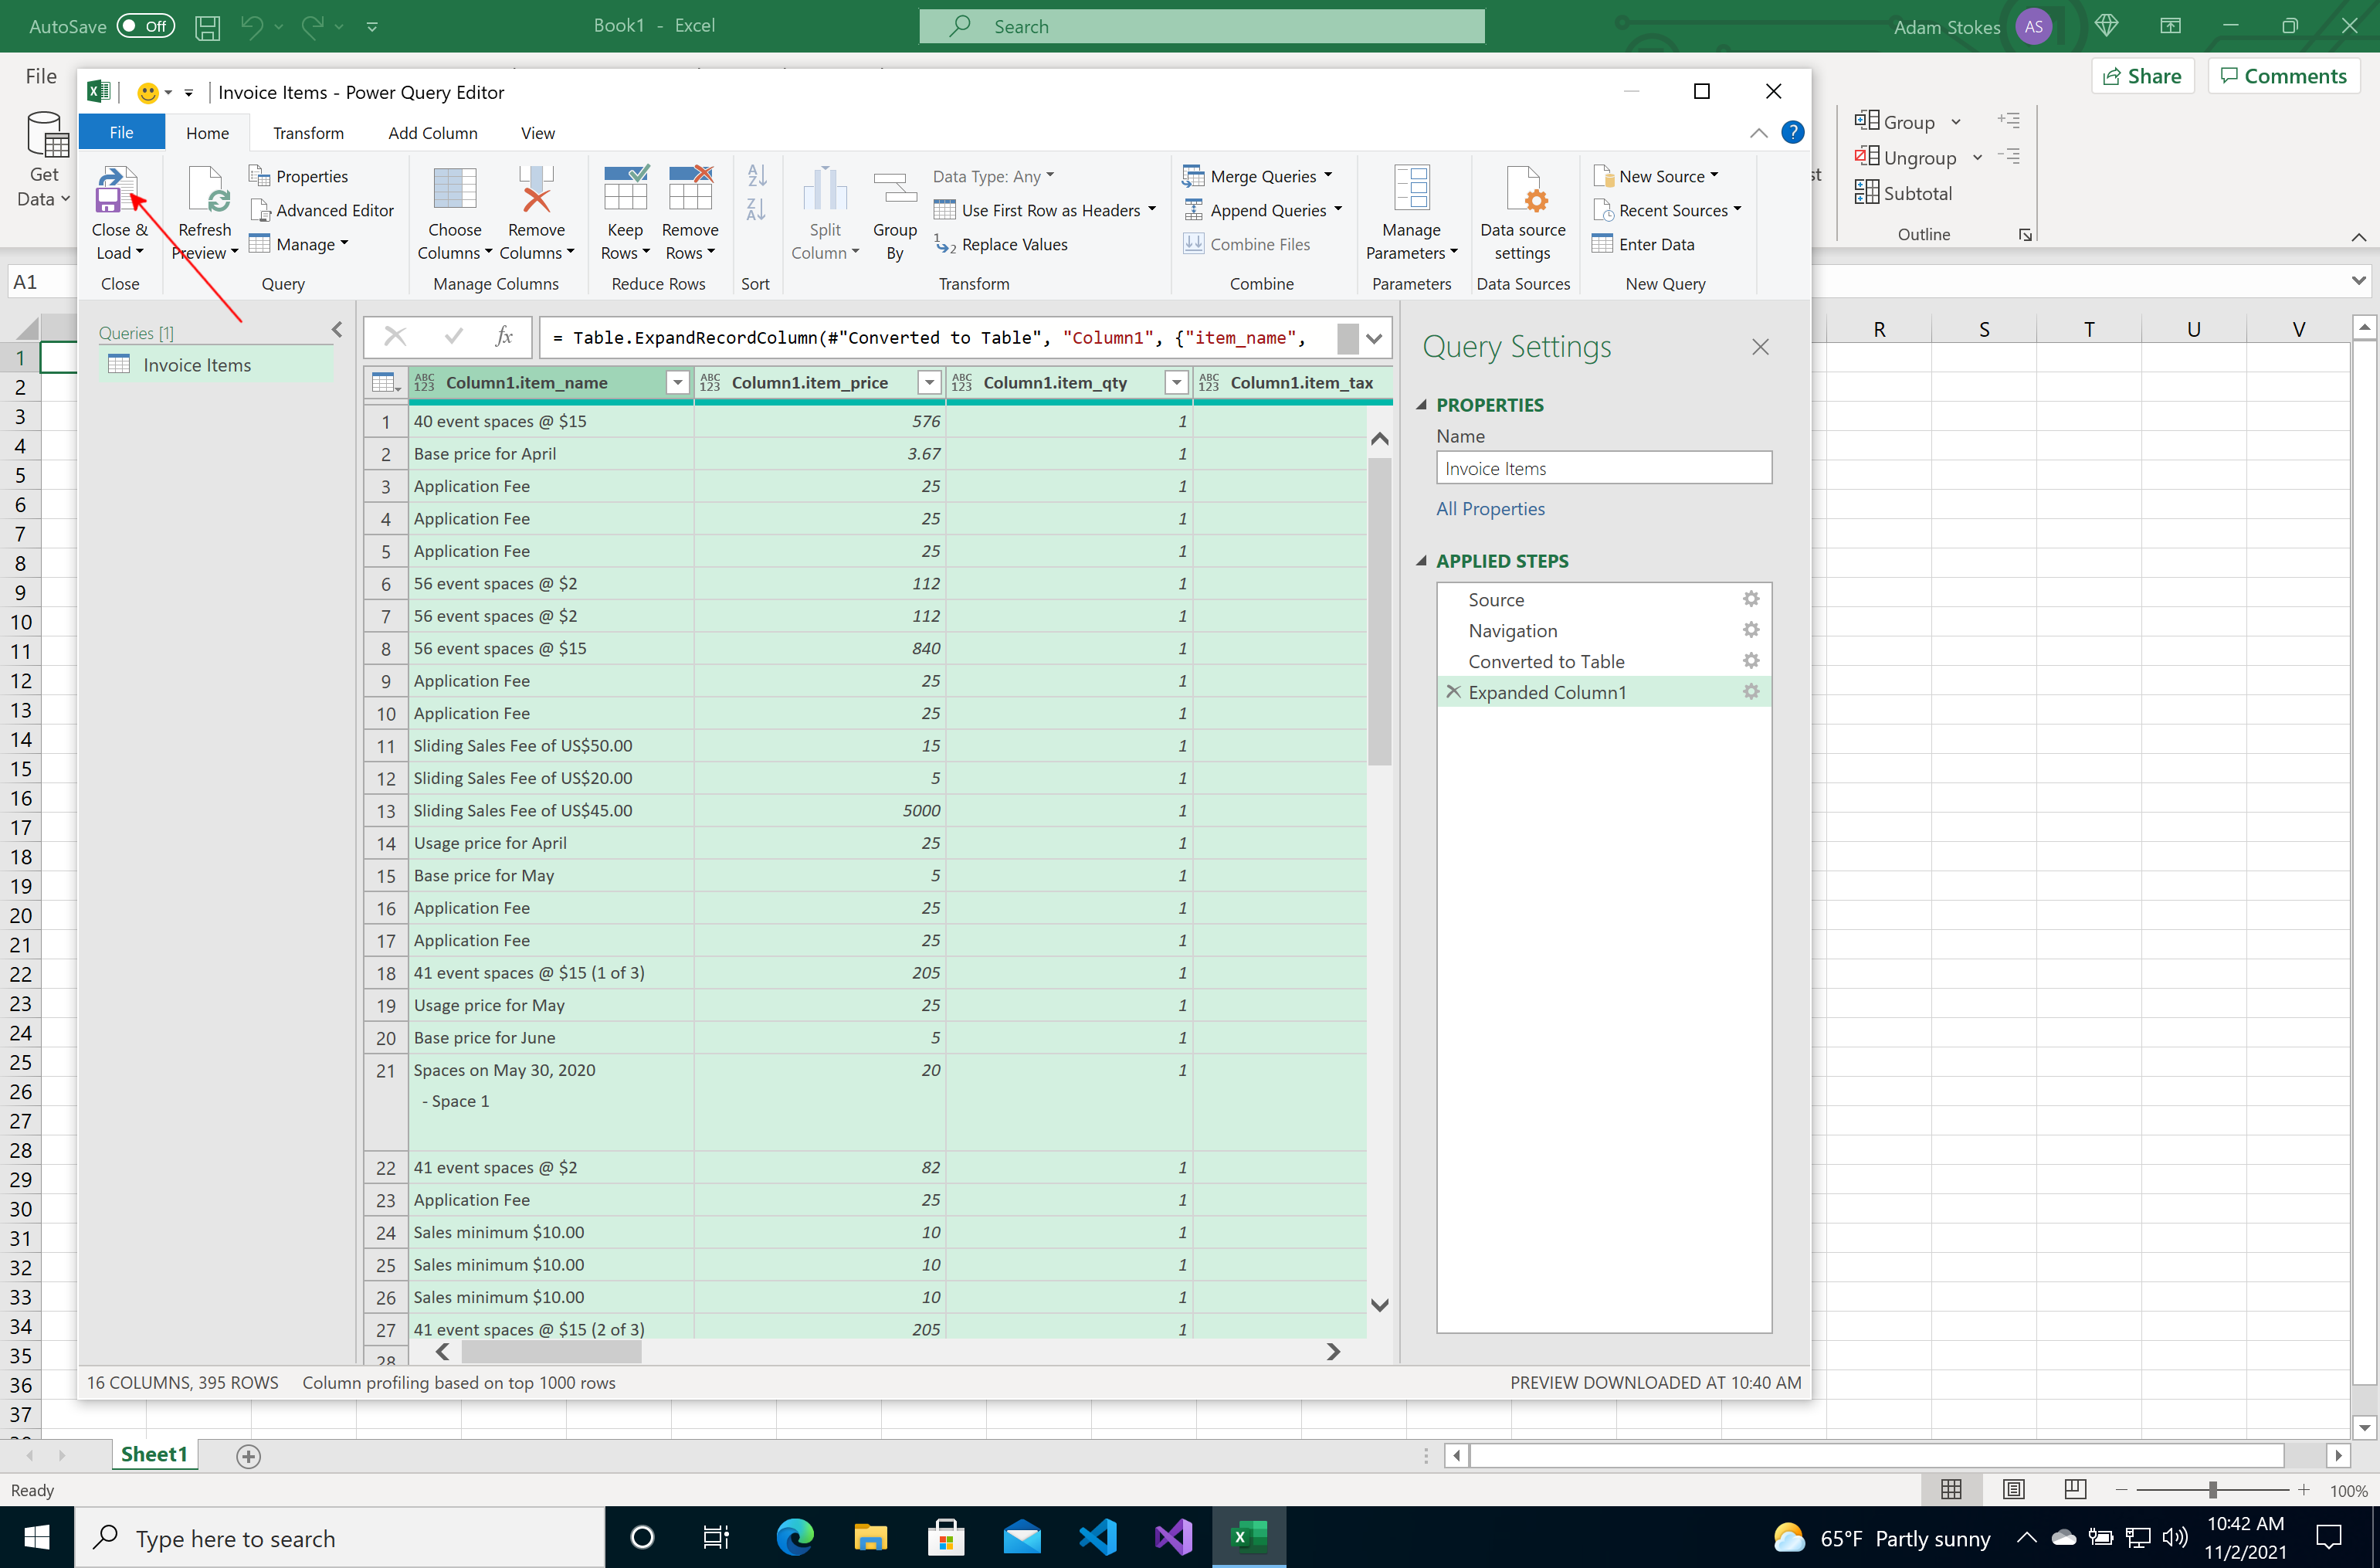
Step 8. Close and load the data into the spreadsheet
At this point the data is translated into something Excel can work with. Finally, press the Close and Load button to import the data into the spreadsheet:
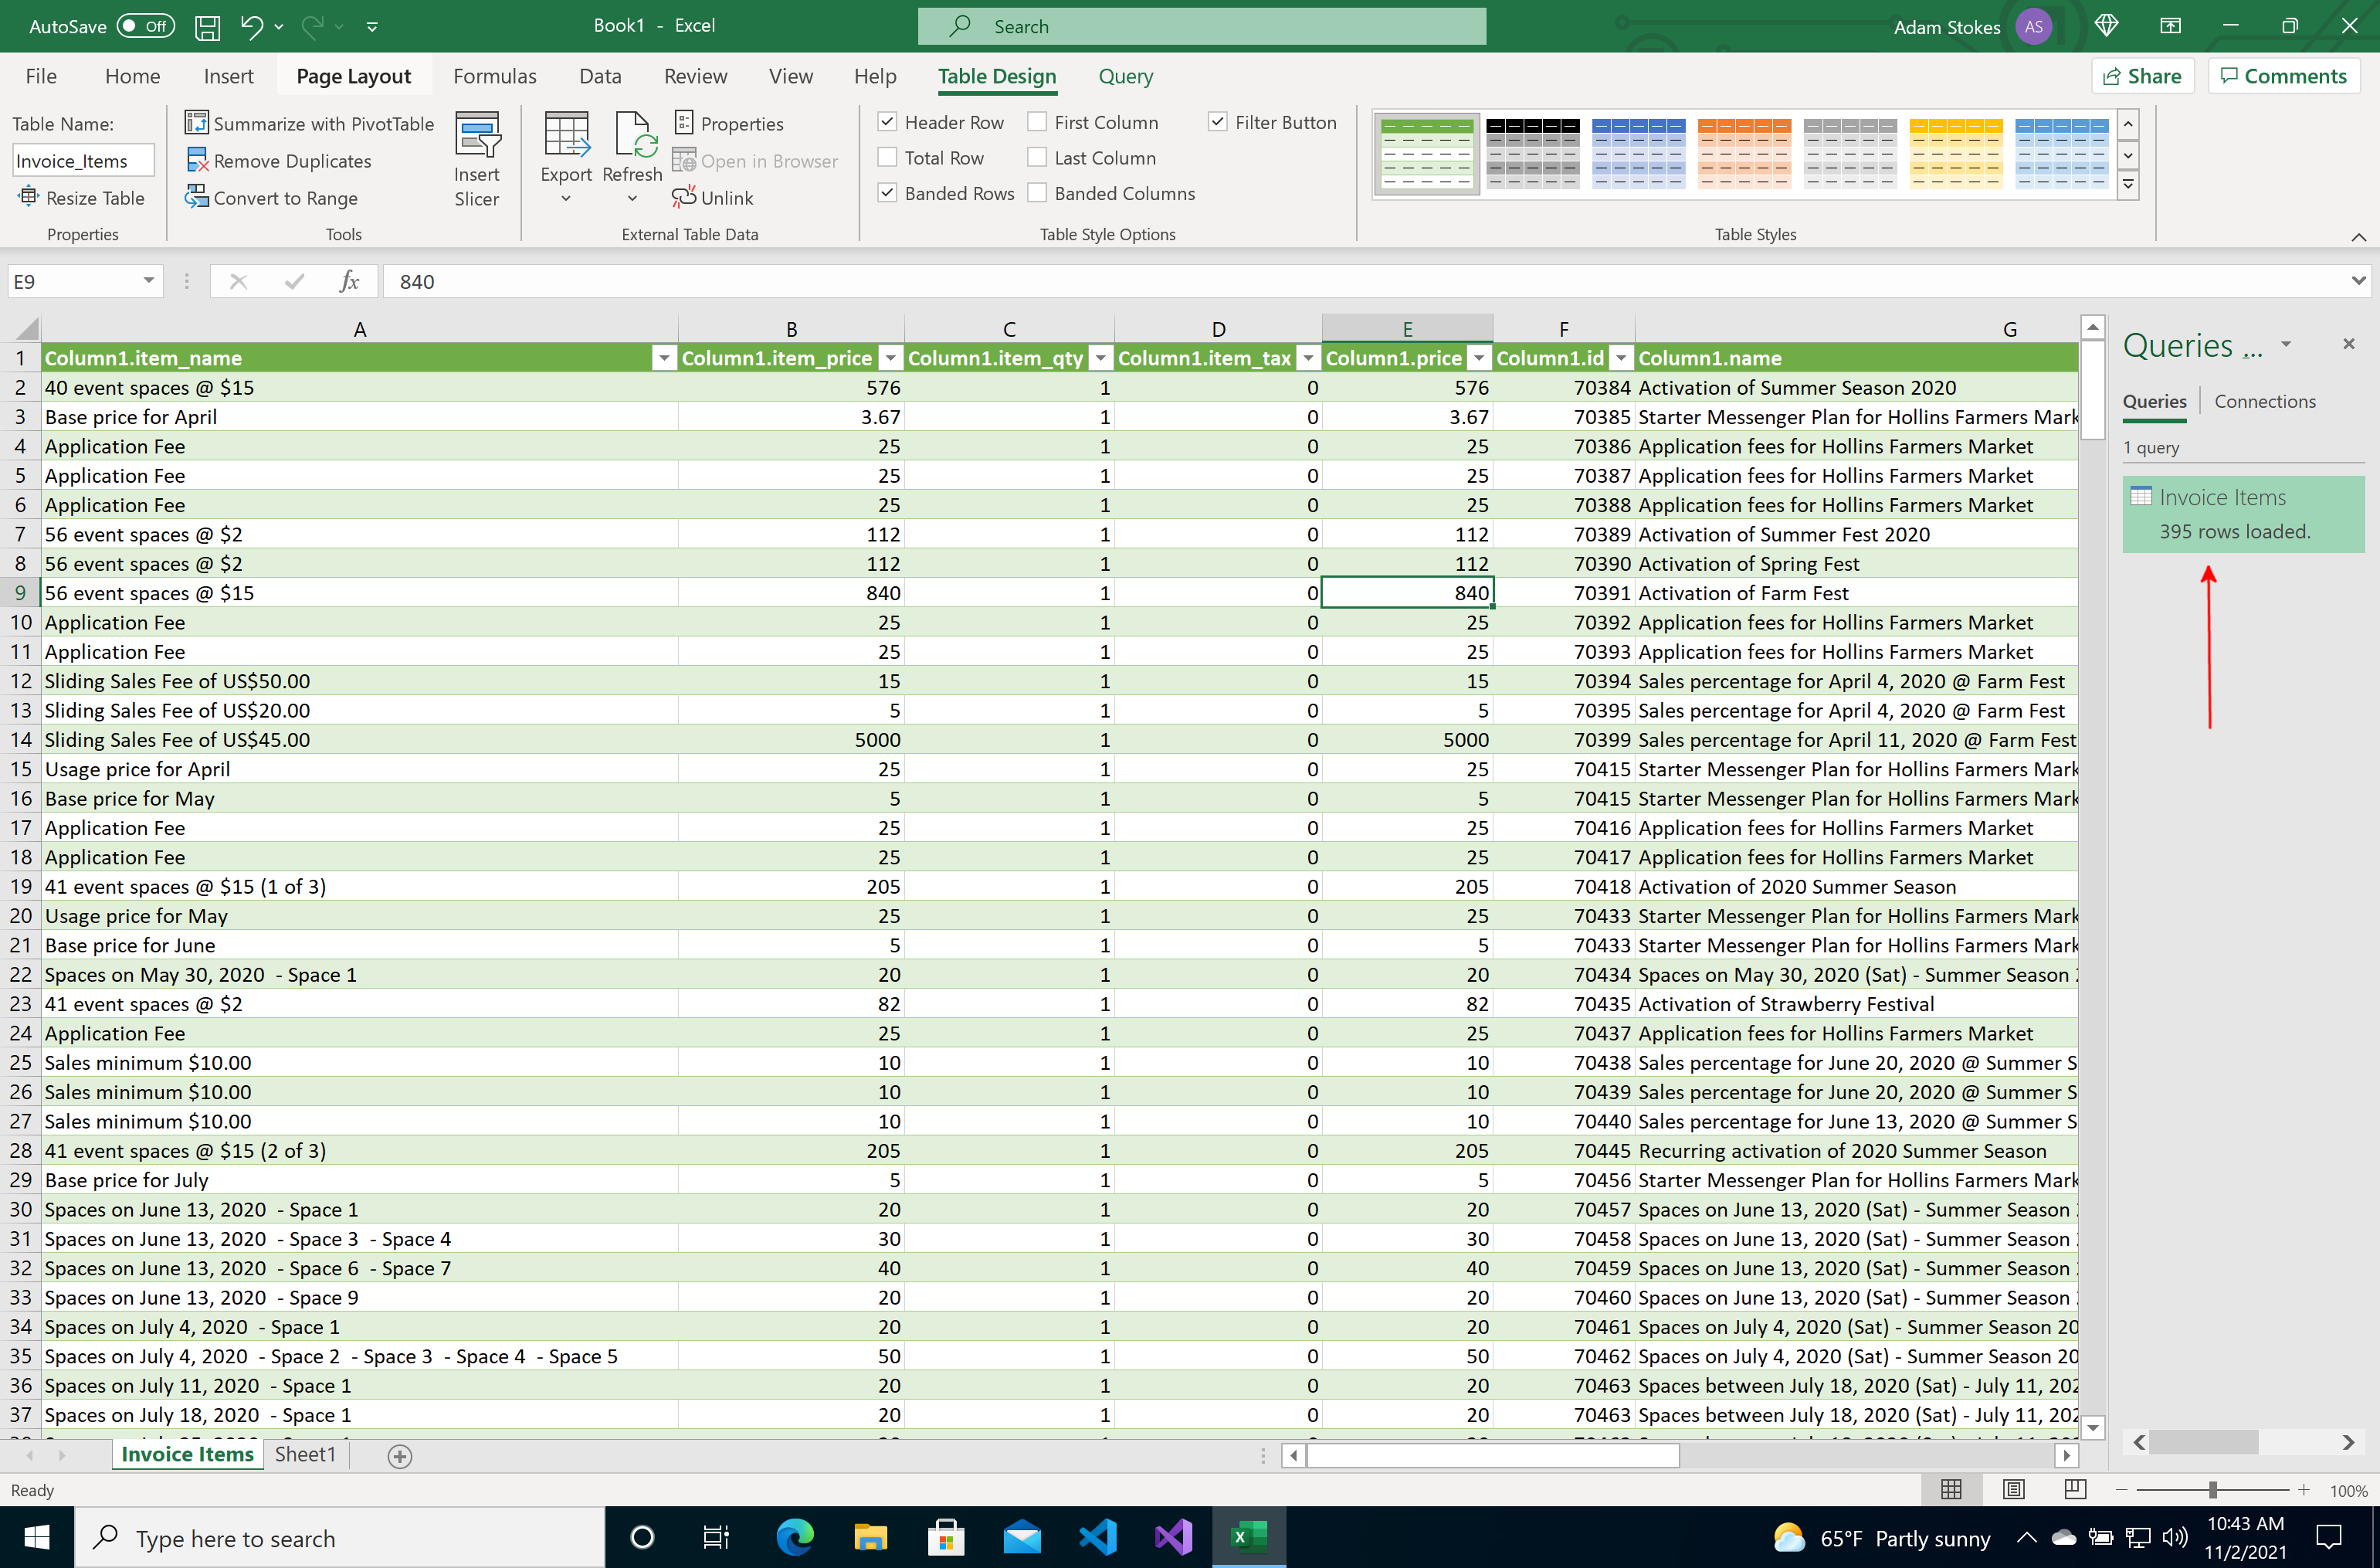
Step 9. Work with the data as usual
At this point the data is now in Excel, there is a Query associated with that spreadsheet as seen on the right hand side of the below screenshot. You now have the ability to utilize all the features of Excel on your report data from Marketspread. Any formulas created will persist across data refreshes and apply to the data as it comes in.
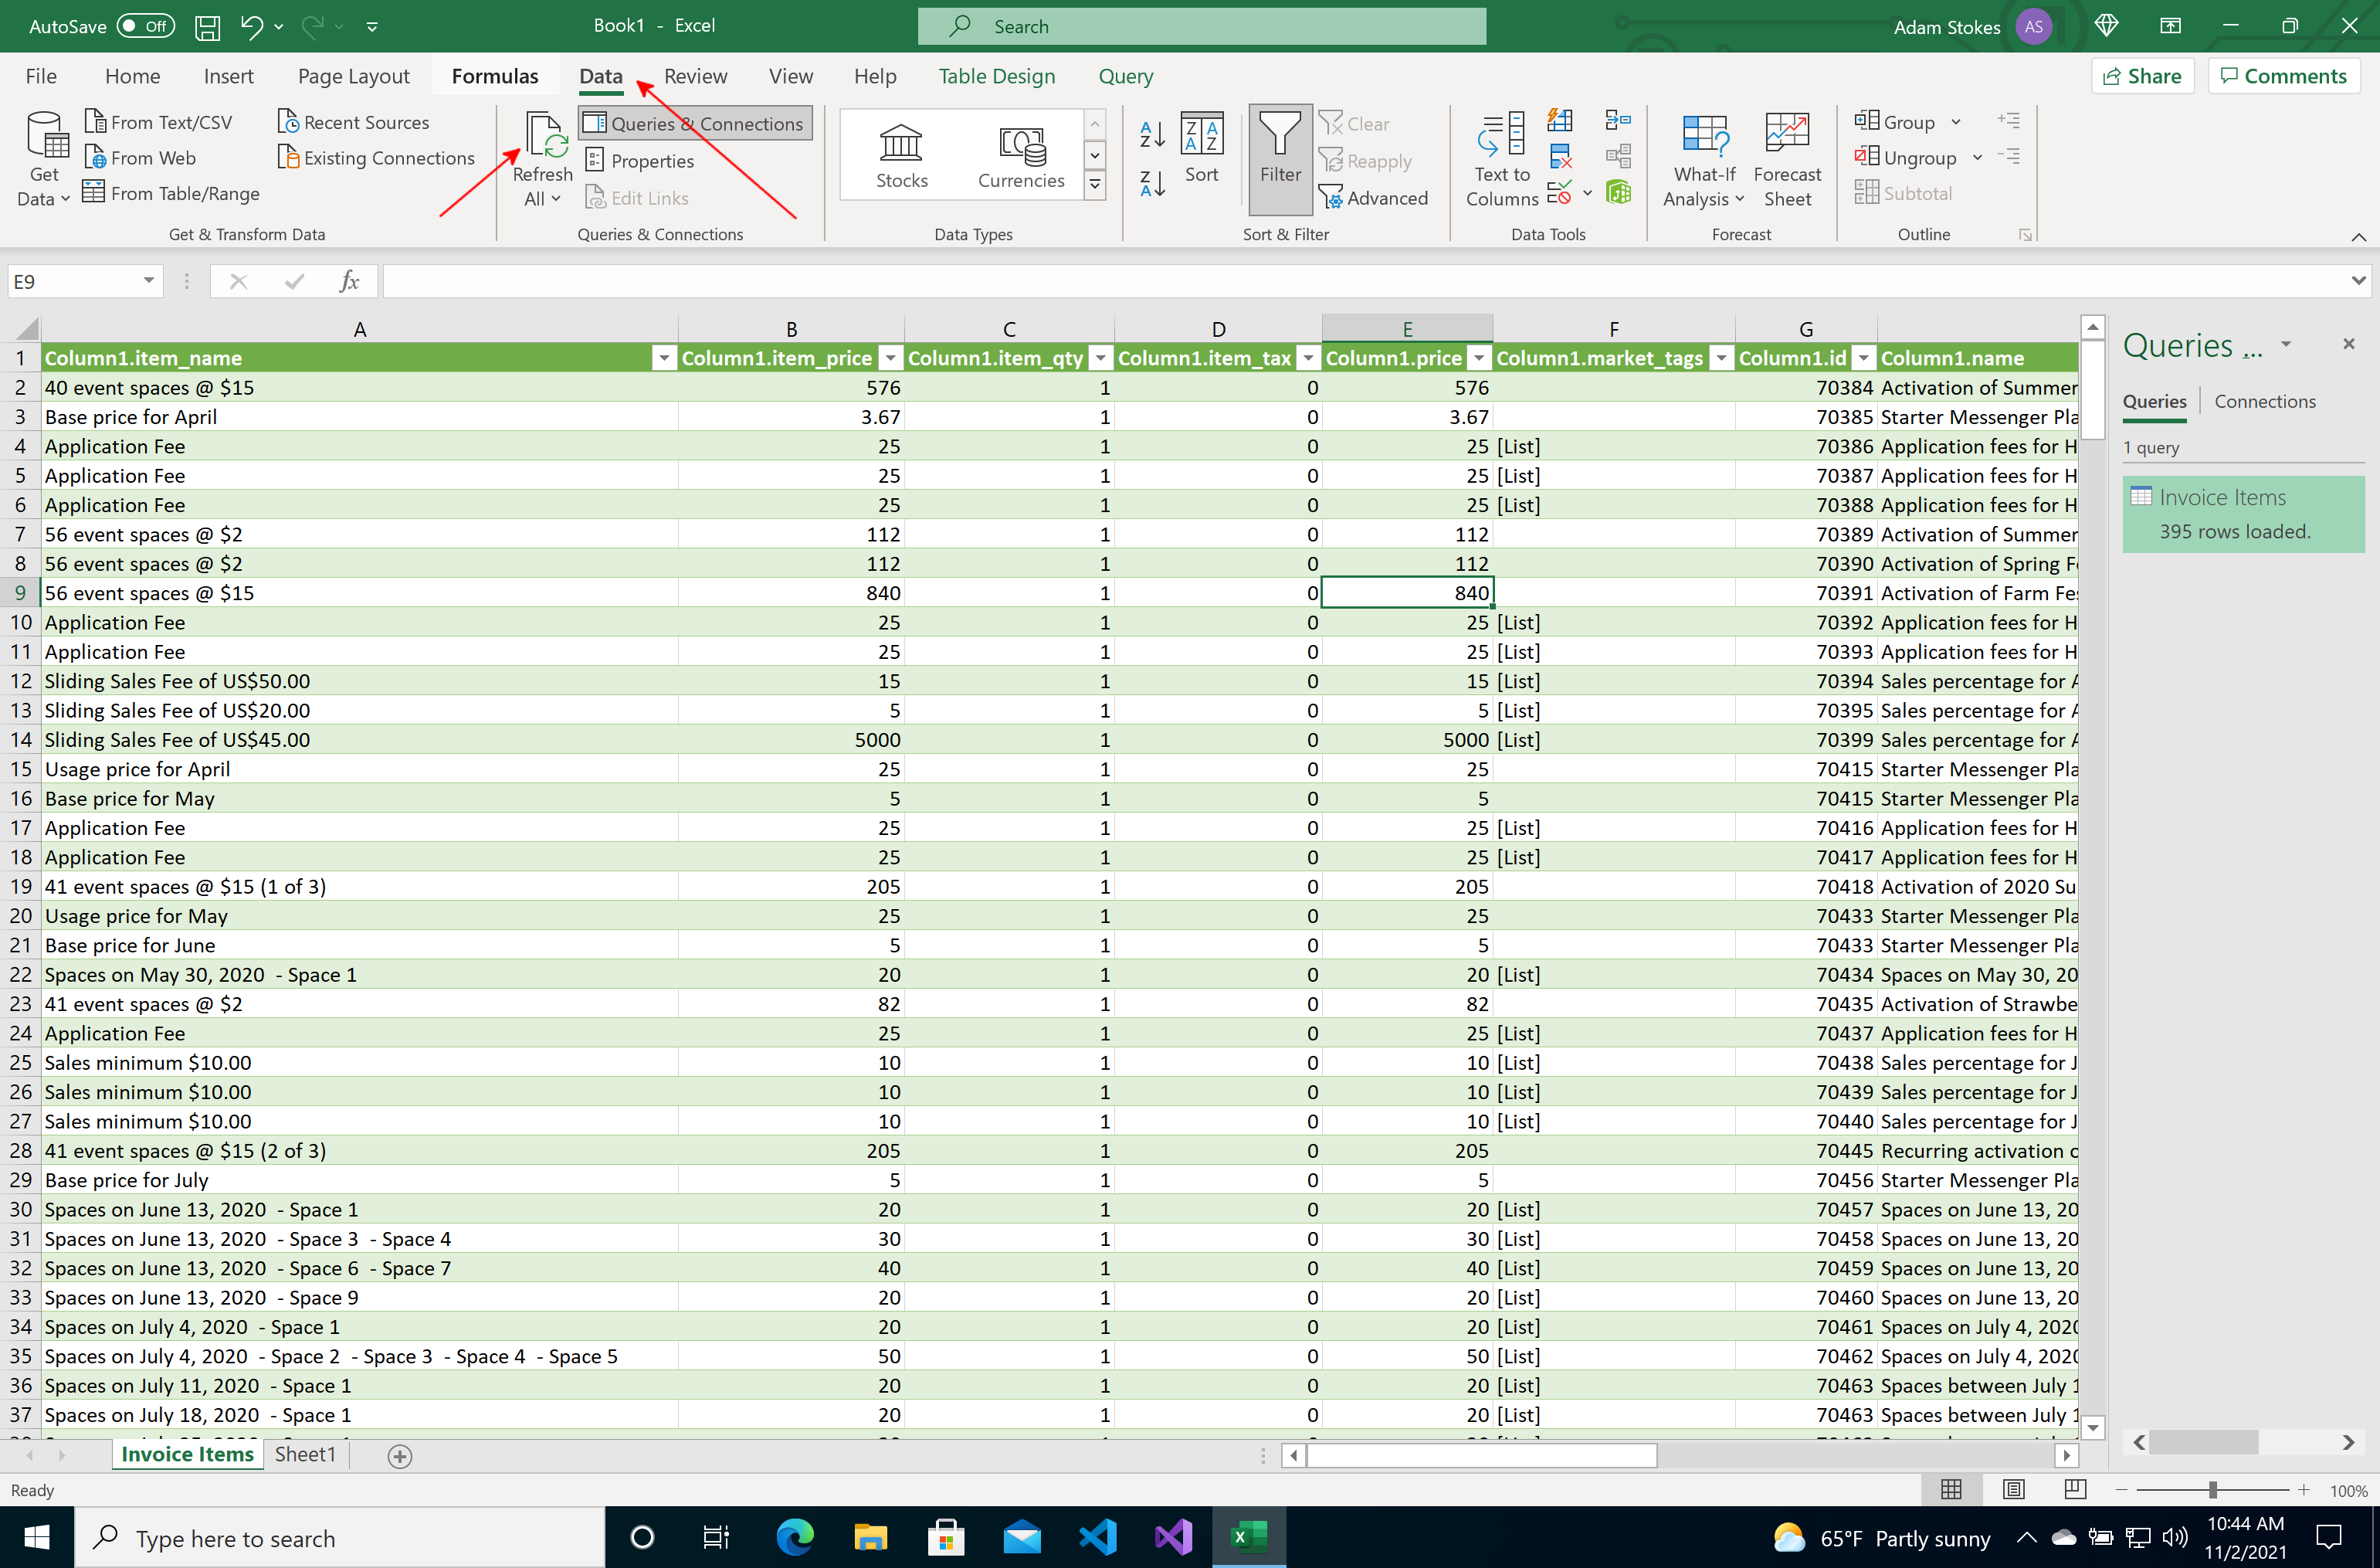
Step 10. Keeping the data updated
As the amount of data increases from use of Marketspread, you can easily pull in fresh data to your existing spreadsheets. Because of the query connection as seen in the previous screenshot the only thing required to pull in new data is to visit the Data menu option and click on Refresh All
All set!
A couple of final things to note here. These steps only have to be done Once per type of report you wish to import into Excel. For each import and subsequent Power Query setup a new spreadsheet will be created for each report in your workbook. Each spreadsheet will then be linked to a Query which can be refreshed at any time using the instructions above.